Figure 2.
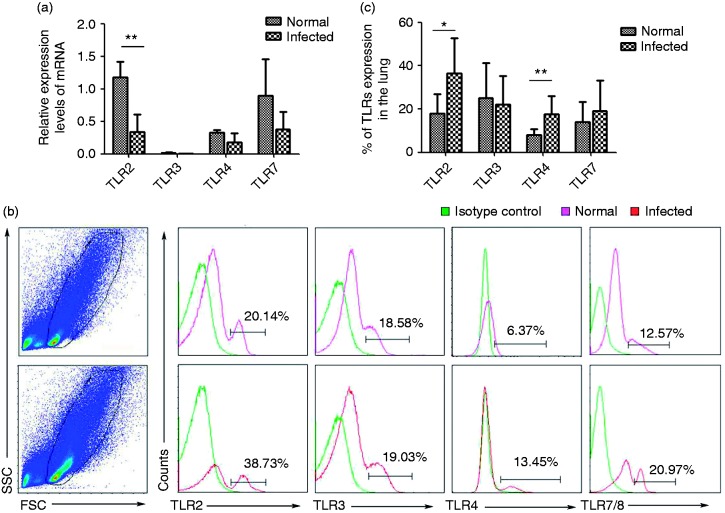
TLR expressions in lymphocytes isolated from control or infected mouse lung. (a) The accumulation of TLR2, TLR3, TLR4, and TLR7 mRNA was quantified by using qPCR. (b) The expression of TLR2, TLR3, TLR4, and TLR7 protein from control or infected lung were analyzed by flow cytometry. Flow cytometric analysis from one representative experiment. (c) Average percentages of TLRs in normal and infected mice were calculated from FACS data (n = 6) (*P < 0.05, **P < 0.01; the error bars indicate SD).

