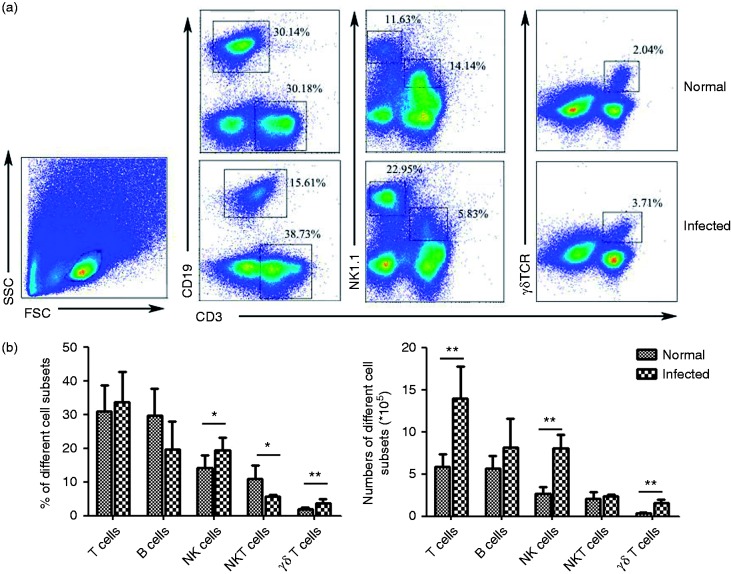
Figure 4.
The percentages and absolute numbers of T cells, B cells, NK cells, and γδT cells. (a) Flow cytometric analysis of CD3, CD19, NK1.1, and γδTCR expression on normal and infected mice lung lymphocytes is shown. Representative FACS plots are shown (n = 6). The numbers represent the percentage of cells in each subset. (b) Average percentages of T cells, B cells, NK cells, NKT cells, and γδT cells were calculated from FACS with the number of lymphocytes counted under microscope. Cell numbers are from different cell subsets (*P < 0.05; the error bars indicate SD).

