Figure 5.
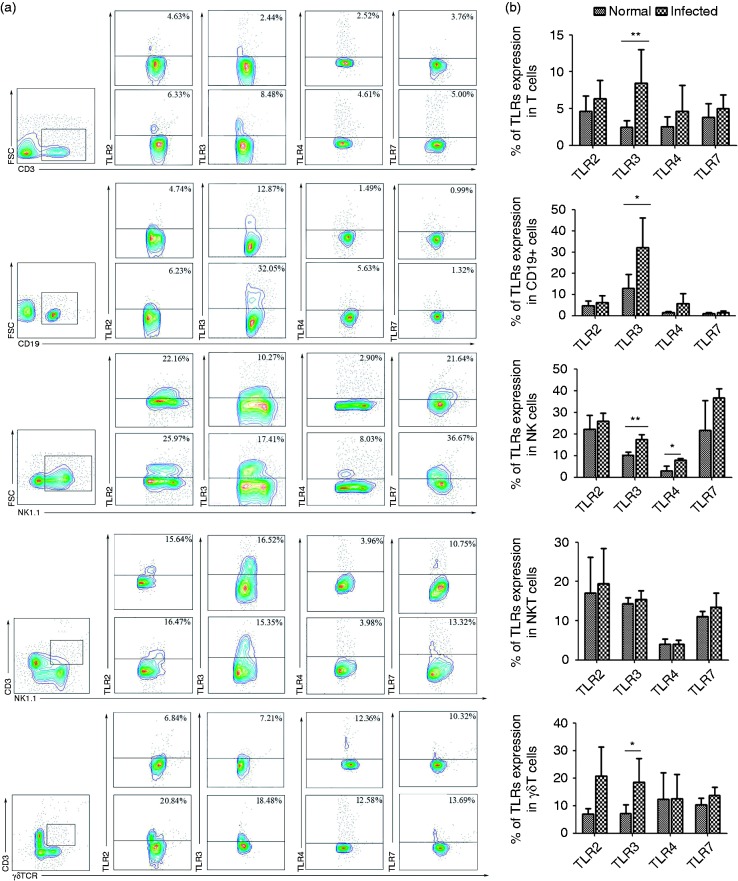
TLR expressions in different lymphocytes isolated from infected and uninfected mouse lung. (a) The percentages of TLR2+, TLR3+, TLR4+, and TLR7+ expressed on T cells, B cells, NK cells, NKT cells, and γδT cells, respectively. Flow cytometric analysis from one representative experiment. (B) The percentages of different TLRs expressed on T cells, B cells, NK cells, NKT cells, and γδT cell in the lung were calculated. The results represent for ten independent experiments (*P < 0.05, **P < 0.01; the error bars indicate SD).

