Figure 3.
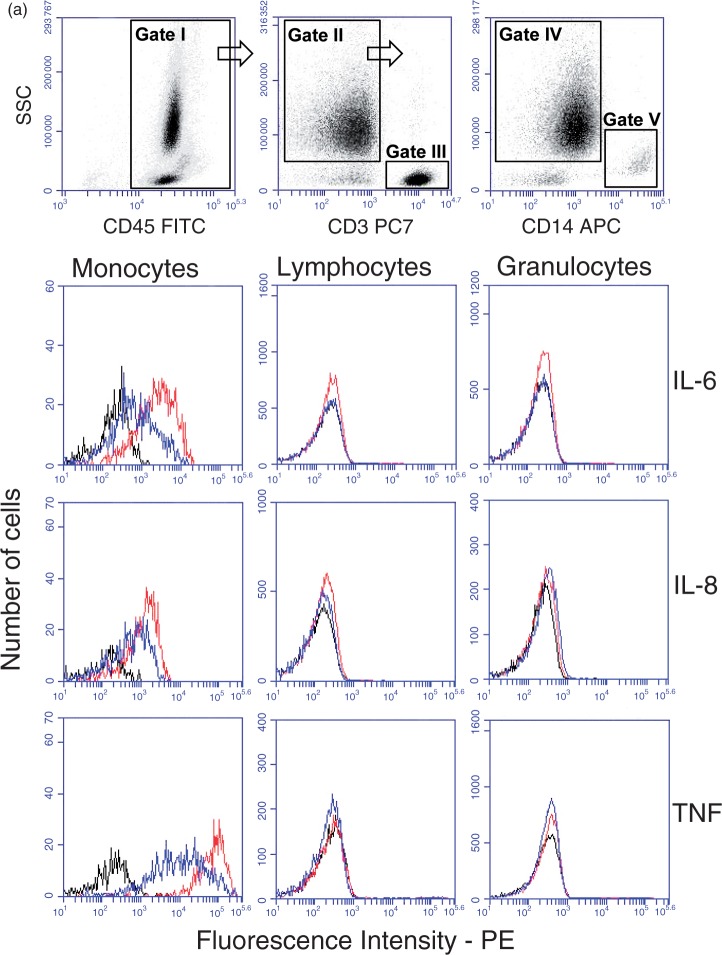
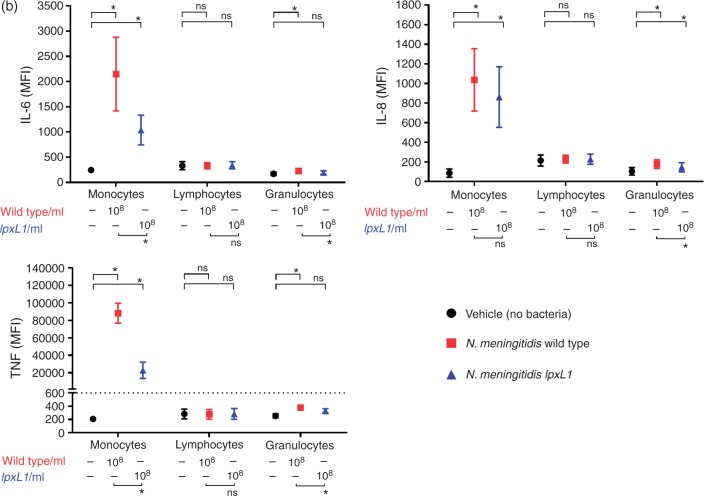
Intracellular cytokine levels in different cell types. Whole blood from eight donors was incubated for 4 h with N. meningitidis wt (108/ml), N. meningitidis lpxL1mutant (lpxL1) (108/ml) or vehicle (no bacteria), and flow cytometry measurements of intracellular cytokines performed. In (a) the gating strategy used to identify the different types of WBCs is shown. WBCs are shown in gate I, CD3+ lymphocytes in gate III, granulocytes in gate IV and CD14+ monocytes in gate V. The cytokine fluorescence intensity (FI) levels of IL-6, IL-8 and TNF-α for monocytes, lymphocytes and granulocytes are displayed in overlay histograms of one representative donor, with lines in black (vehicle), red (108/ml N. meningitidis wt) and blue (108/ml N. meningitidis lpxL1 mutant). In (b) intracellular levels of IL-6, IL-8 and TNF-α in monocytes, lymphocytes and granulocytes are presented as median (range) of MFI. *(Top of charts) indicates significant differences in intracellular cytokine MFI between the wt and vehicle or between the lpxL1 mutant and vehicle (P < 0.05). *(Below charts) indicates significant differences between the wt and the lpxL1 mutant (P < 0.05). ns: non-significant differences.


