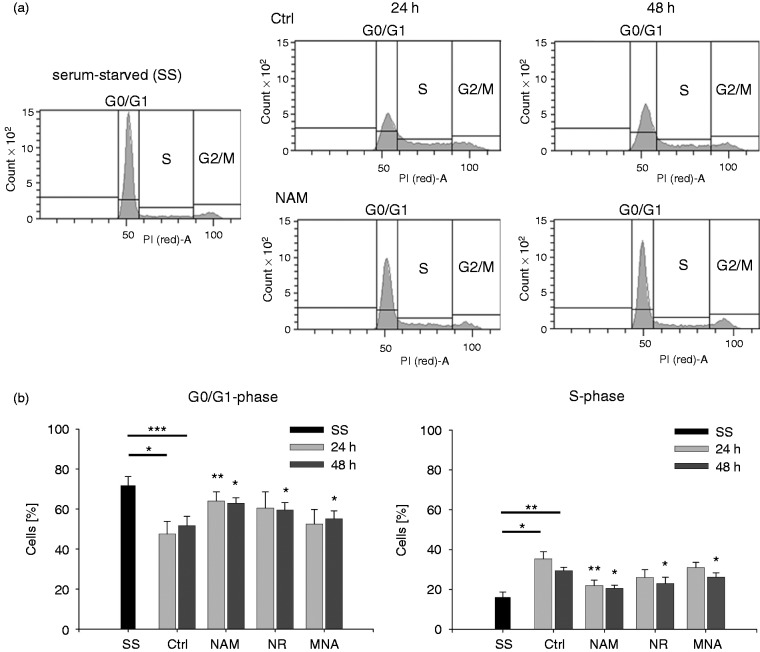
Figure 3.
Cell cycle analyses after treatment with NAM, NR and MNA. THP-1 cells (0.2 × 10⁶/ml) were serum-starved (SS) for 48 h. Upon addition of serum, the cells were cultured in the presence of NAM, 8 mM NR, 3.2 mM MNA or the respective solvent control (ctrl) and cell cycle analyses were performed after 24 h and 48 h by flow cytometry. (a) One representative experiment of NAM treated cells is shown. Cell cycle phases were defined by DNA staining with propidium iodide (PI). (b) Percentages of cells in G0/G1- and S-phases. Shown are mean values ± SD (n = 3). Statistics were performed with the paired Student’s t-test calculated to the respective control.

