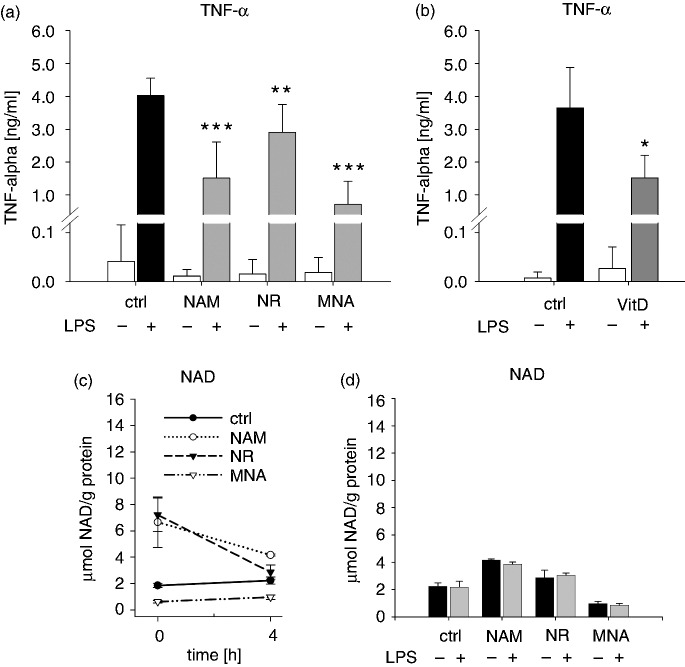
Figure 9.
LPS-induced TNF-α production and NAD-content. THP-1 cells (0.2 × 10⁶/ml) were treated with (a) 8 mM NAM, (c) 8 mM NR, (d) 3.2 mM MNA and (b) 0.1 mM VitD or the respective control (ctrl). After 96 h the cells (1 × 10⁶/ml) were incubated for further 4 h in the absence and presence of 100 ng/ml LPS. (a, b) TNF-α concentrations in the supernatants were measured by ELISA. Shown are mean values ± SD ((a) n = 6; (b) n = 3). NAD values of (c) unstimulated and (d) LPS-stimulated cells were normalised to the total protein content. Shown are means ± SD (n = 3). Statistics were performed with the paired Student’s t-test calculated to the respective control.

