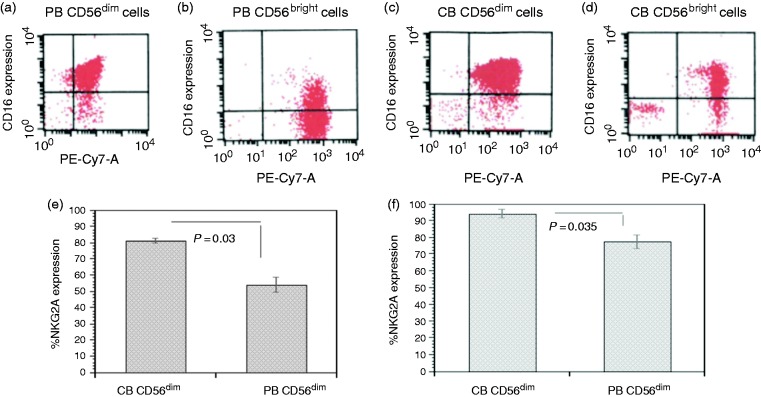
Figure 1.
Characterization of PB and CB CD56dim/CD16bright, CD56bright/CD16bright, populations and receptor expression of CB NK CD56+dim compared with PB CD56+dim NK cells. Flow cytometry histogram of PB CD56dim/CD16bright (a), PB CD56bright/CD16bright (b), CB CD56dim/CD16bright (c), and CB CD56bright/CD16bright (d) populations. When compared with PB CD56+dim, CB CD56+dim demonstrated a significant increased expression of NKG2A (P < 0.03, e) and NKG2D (P < 0.035, f ). n = 5.

