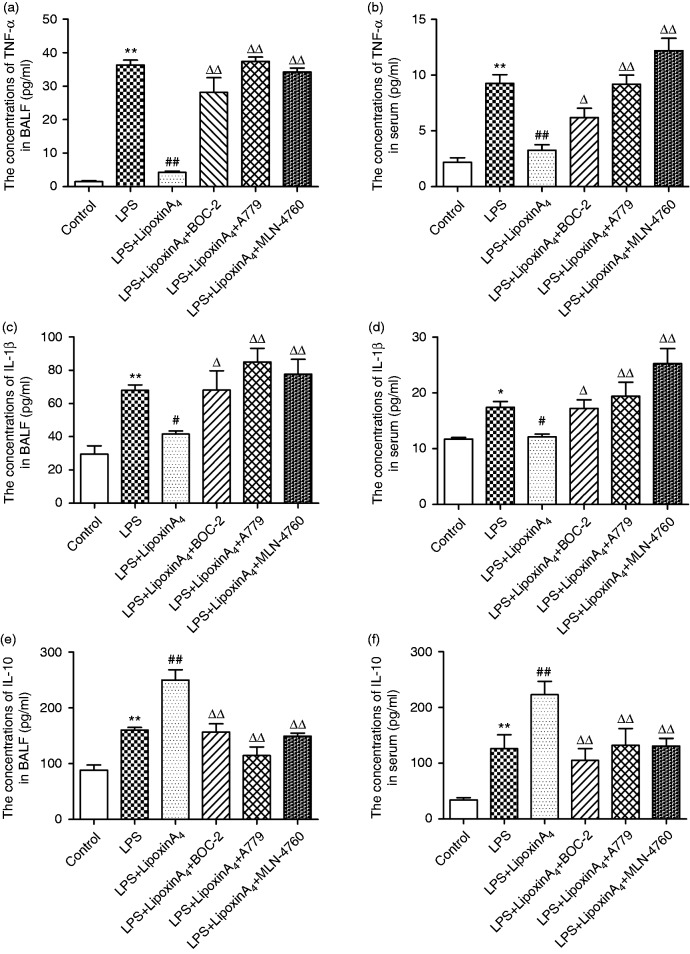
Figure 3.
LXA4 regulates LPS-induced inflammation via the ACE2-Ang-(1-7)-Mas axis in ALI. (a and b) The concentrations of TNF-α in the BALF (a) and serum (b). (c and d) The concentrations of IL-1β in the BALF (c) and serum (d). (e and f) The concentrations of IL-10 in the BALF (e) and serum (f). Data are presented as means ± SEM. *P < 0.05 and **P < 0.01 compared with control group, #P < 0.05 and ##P < 0.01 compared with LPS group, ΔP < 0.05 and ΔΔP < 0.01 compared with LPS + LXA4 group.

