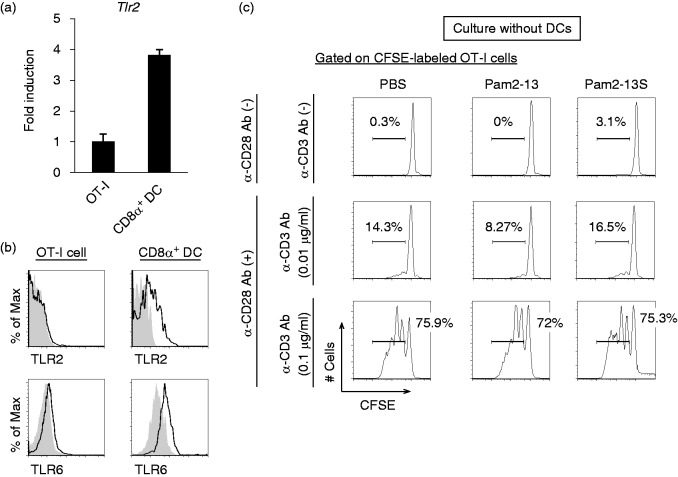
Figure 2.
Pam2-13s is not directly recognized by OT-I cells. (a) Tlr2 gene expression level on OT-I cells and CD8α+ DCs isolated from OT-I mouse were analysed by real-time PCR. Error bars show ±SD. (b) Splenocytes were harvested from OT-I mouse and TLR2. TLR6 expression levels on OT-I cells (CD8α+ CD3+ population) and CD8α+ DCs (CD8α+ CD11chi population) were analysed by flow cytometry. Shaded and open histograms indicate isotype control and TLR2, TLR6 staining, respectively. (c) CFSE-labelled OT-I cells were cultured singularly in the presence or absence of anti-CD28 and anti-CD3 Abs. PBS, Pam2-13 and Pam2-13s were added to the culture media. After 60 h, the degree of OT-I proliferation was assessed. The histograms of each sample are shown.

