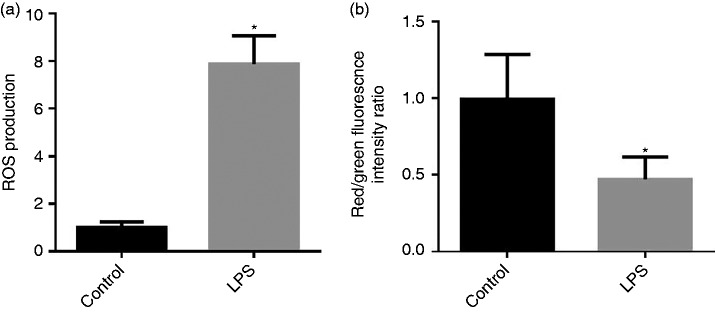
Figure 2.
(a) Effect of LPS injection on intestine mitochondrial (mt) reactive oxygen species (ROS) production of piglets. (b) Effect of LPS injection on intestinal mt membrane potential change (△Ψm) of piglets. Values are means and SD represented by vertical bars. Control group (black bars), injected with 0.9% (w/v) NaCl solution. LPS group (gray bars), injected with LPS at 100 µg/kg BM. The ROS production and mt △Ψm were expressed as fold changes, calculated relative to the control group.

