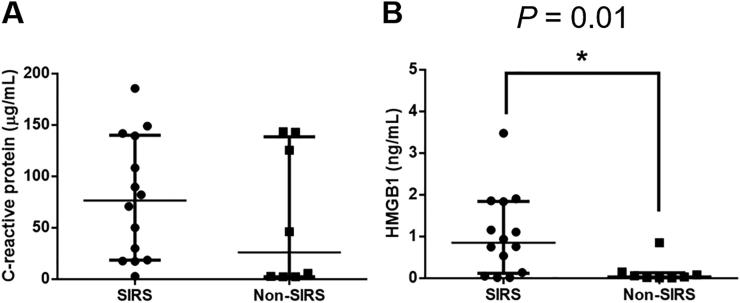
Figure 2.
Comparison of the serum concentrations of (A) C-reactive protein and (B) HMGB1 between SIRS (n = 14) and non-SIRS (n = 8) dogs with AP at admission. The horizontal bars indicate the medians and interquartile ranges. *P < 0.05 (Mann–Whitney U test). HMGB1, high mobility group box 1; SIRS, systemic inflammatory response syndrome.

