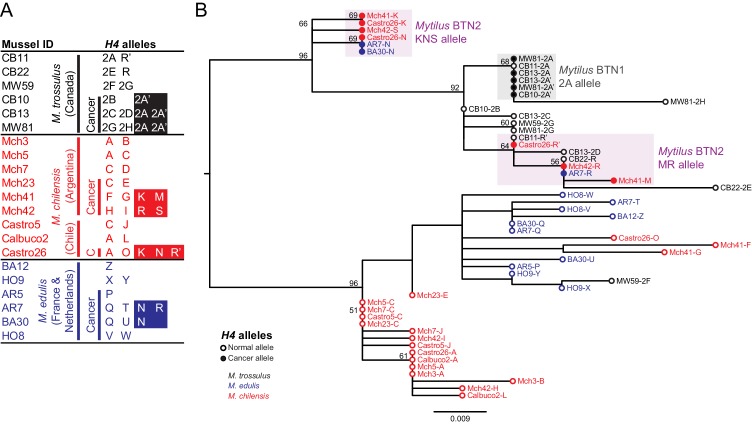
Figure 2. Phylogenetic analysis of H4 alleles from normal and diseased mussels.
The H4 locus was amplified, and multiple alleles were cloned from different individual normal and diseased mussels of different species and locations: M. trossulus from BC (black), M. chilensis from Argentina and Chile (red), and M. edulis from France and the Netherlands (blue). (A) A list of cloned alleles is shown, with filled boxes marking cancer-associated alleles. (B) Phylogenetic analysis of aligned alleles shows groups of related alleles (see Figure 2—source data 1). Names of alleles on the tree specify individual ID and allele ID. Open circles mark alleles from normal individuals and host alleles from diseased individuals. Closed circles mark cancer-associated alleles (colored by host species). The tree was rooted at the midpoint, with bootstrap values below 50 removed. Model used was HKY85+I. The scale bar marks genetic distance. Three sequences (AR7-2I, BA30-2J, and Castro26-2J) are consistent with recombination between the two cancer-associated alleles and were removed from the tree for clarity. The two alleles identified in the Mytilus BTN1 lineage (2A and 2A’) are distinguished by a unique single base deletion in 2A’, which does not show up as a difference in the tree, as gaps are treated as missing data.

