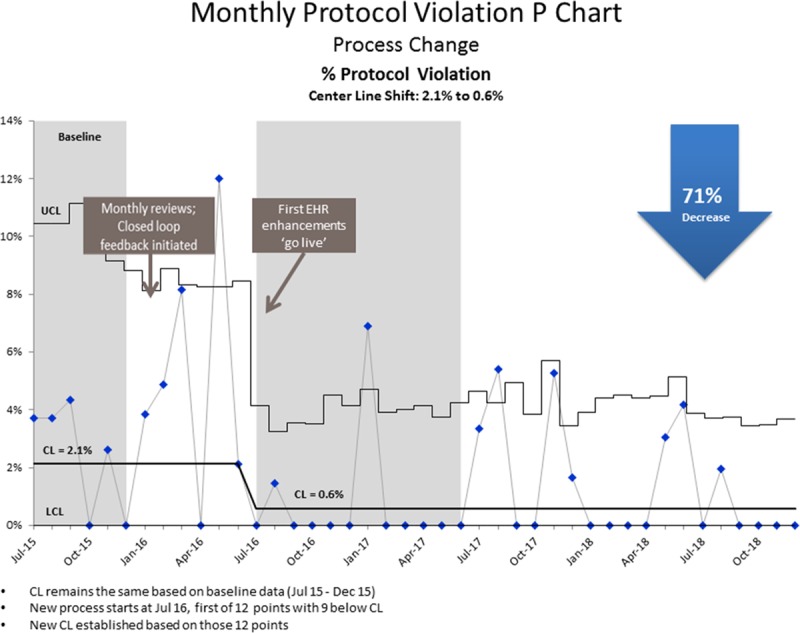
Fig. 5.

Quality improvement in critical congenital heart disease screening percent protocol violations. This control chart displays the average percentage of protocol violations over the period from July 2015 to December 2018. Based on 9 out of 12 data points below the centerline, in July of 2016, a new centerline was calculated around an average of 0.6% of protocol violations. This is a reduction from 2.1%, which is a 71% decrease. CL, centerline; UCL, upper control limit; LCL, lower control limit.
