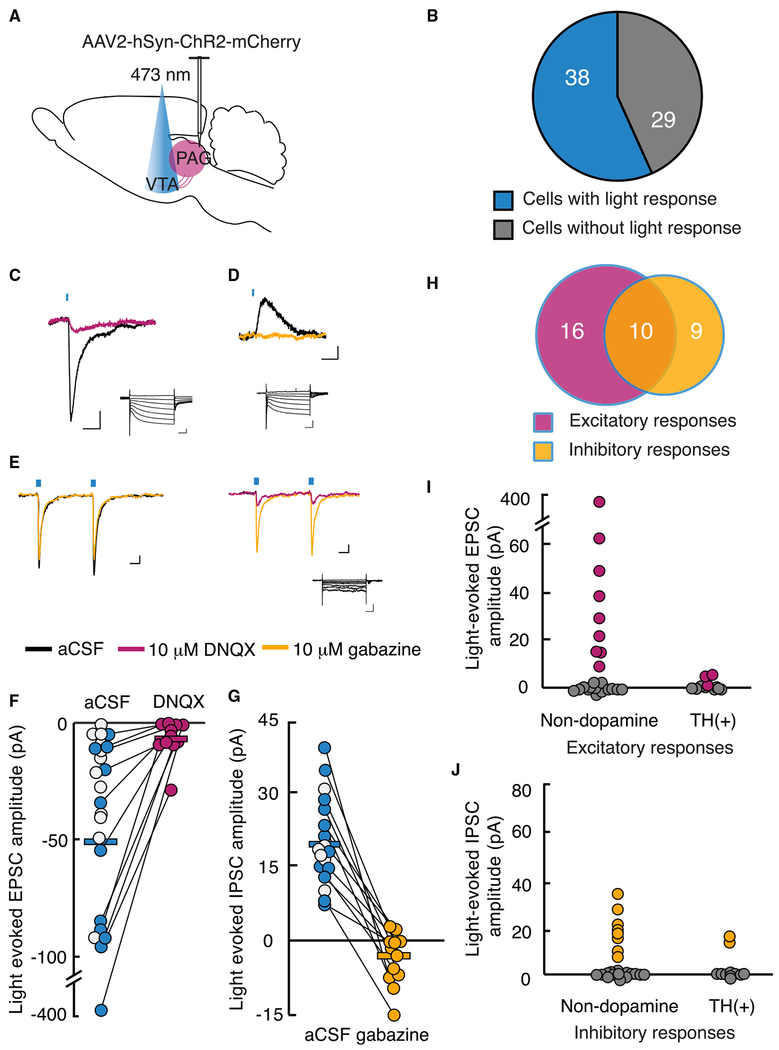
Figure 2. Most VTA Neurons Receive Synaptic Inputs from the vlPAG.
(A) Schematic of bilateral injection of AAV2-hSyn-ChR2-mCherry into vlPAG. 4-6 weeks after injection, acute VTA slice from 20 animals were prepared for whole-cell recordings.
(B) Graphical representation of the number of VTA neurons with light-stimulated synaptic potentials following ChR2 expression in vlPAG neurons.
(C and D) Example responses to brief, 470 nm light pulses recorded in voltage clamp. Magenta trace (C); after bath application of 10 μM DNQX at holding potential of −60 mV (scale bar, 20 pA, 10 ms). Yellow trace (D); after 10 μM gabazine at holding potential of −40 mV (scale bar, 5 pA, 10 ms). Insets: responses to voltage steps demonstrating Ih (scale bar, 200 pA, 100 ms).
(E) Sample traces from an individual neuron receiving both excitatory and inhibitory light-evoked post-synaptic currents with holding potential at −60 mV using a high-chloride (KCI) internal solution (scale bar, 20 pA, 10 ms). Inset: response to voltage steps (scale bar, 100 pA, 100 ms).
(F) EPSC amplitudes recorded at −60 mV using K-gluconate internal solution, plotted before and after DNQX application. Each circle represents one neuron; white circles represent presumed glutamatergic responses, but DNQX was not bath applied.
(G) IPSC amplitudes recorded at −40 mV holding potential reduced with gabazine (white circles not tested with gabazine).
(H) Excitatory (magenta) and inhibitory (yellow) inputs from the vlPAG converge onto a proportion of VTA neurons from 35 neurons in which EPSCs and IPSCs could be differentiated.
(I) EPSC amplitudes in confirmed non-dopamine neurons compared with TH(+) neurons.
(J) IPSC amplitudes in confirmed non-dopamine neurons compared with TH(+) neurons.
See also Figures S1 and S2.

