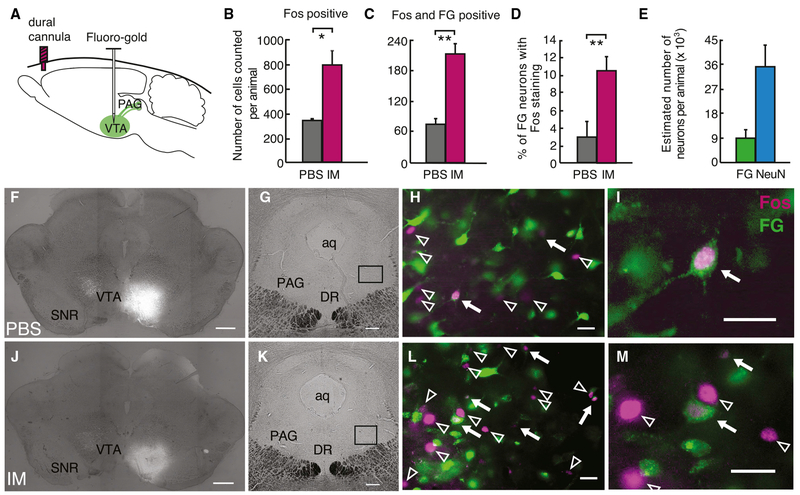
Figure 3. A Subset of PAG Neurons that Project to the VTA Is Activated with Headache.
(A) Schematic of retrograde marker Fluoro-Gold (FG) injection into the VTA. 5-7 days after injections, animals were treated with dural PBS or IMs. Two hours later, animals underwent intracardiac perfusion with 4% paraformaldehyde, and coronal slices of the PAG were systematically collected and labeled with a Fos antibody.
(B and C) Number of Fos(+) cells (B) and double-labeled Fos- and FG-positive cells (C) counted using stereological methods in the vlPAG using an optical fractionator probe (n = 3 animals per condition, *p < 0.05, **p < 0.01).
(D) Percentage of FG-positive cells that were also Fos(+) (**p < 0.005).
(E) Estimated number of FG- and NeuN-positive cells in the vlPAG (n = 3 animals). All plots represent mean ± SEM.
((F-M) Example coronal slices in animals treated with dural PBS (F, G, H, and I) or IM (J, K, L, and M).
(F and J) Images in (F) and (J), demonstrating unilateral VTA injection sites, were acquired and stitched with 2D slide scan in MBF Stereoinvestigator (scale bar, 500 μm).
(G and K) Coronal vlPAG slices, with indication of the locations of higher-magnification images in (H) and (L), respectively (scale bar, 250 μm).
(H and L) Fos(+) cells (magenta) and FG-positive cells (green) in the vlPAG. White arrows indicate Fos-labeled cells, and arrowheads indicate double-labeled neurons (scale bar, 25 μm).
(I and M) High magnification of Fos(+) cells with and without FG double-labeling (scale bar, 25 μm).

