. 2019 Oct 28;8:e49493. doi: 10.7554/eLife.49493

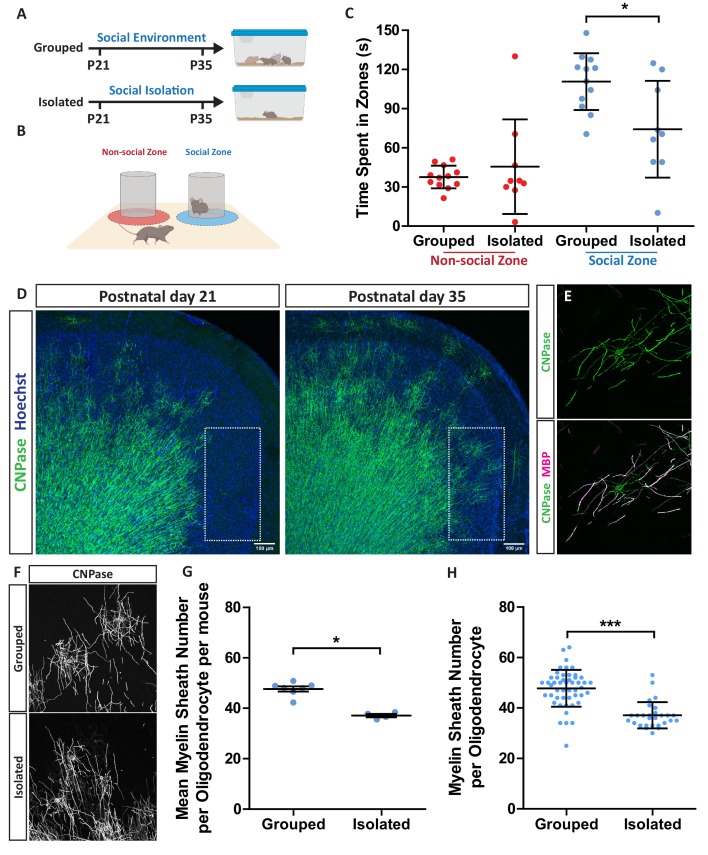
Figure 1. Social isolation in mice reduces layer II/III medial prefrontal cortex oligodendrocyte myelin sheath number.

(A) Timeline for social isolation experiment. At postnatal day 21 male mice were housed in a social environment containing 3–5 mice or on their own in isolation. Mice were analysed at P35. (B) Schematic of social interaction assay. Mice were recorded for 5 min exploring an arena containing two identical wire mesh containers: one container housed an unrelated male wild type mouse (social zone), while the other remained empty (non-social zone). (C) Time spent within 2.5 cm of non-social container: Grouped 37.58 s ± 8.683 n = 12, Isolated 45.59 ± 36.28 n = 9 and social container: Grouped 110.7 s ± 21.71 n = 12, Isolated 74.24 s ± 37.07 n = 9 (mean ± standard deviation). Unpaired T-test p=0.0107. (D) Coronal section of mouse prefrontal cortex stained for CNPase and nuclei. Layers II/III of the medial prefrontal cortex outlined by dashed box. Scale bars = 100 μm. (E) Layer II/III oligodendrocyte stained for CNPase and MBP. (F) Representative images of medial prefrontal cortex oligodendrocytes stained for CNPase. (G) Mean number of myelin sheaths formed by oligodendrocytes per mouse. Grouped 47.66 ± 1.015 n = 7 mice, Isolated 37.11 ± 0.6425 n = 4 mice (mean ± standard error). Mann-Whitney test, p=0.0106. (H) Pooled data for number of myelin sheaths formed by layer II/III medial prefrontal cortex oligodendrocytes. Grouped 47.80 ± 7.289 n = 49 cells from seven mice, Isolated 37.11 ± 5.202 n = 28 cells from four mice (mean ± standard deviation). Mann-Whitney test, p=<0.001.

Figure 1.

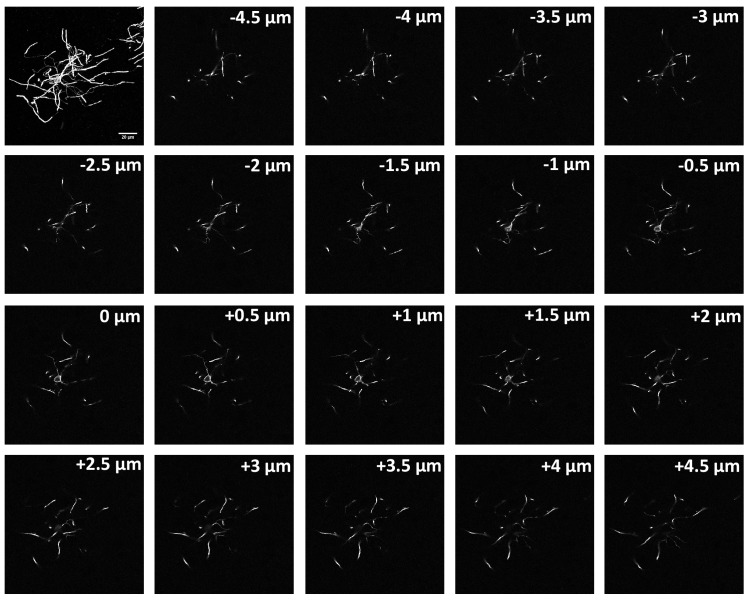
Figure 1—figure supplement 1. Z-stack through a CNPase positive oligodendrocyte.

Figure 1—figure supplement 1.

A full maximum intensity projection of a complete a layer II/III oligodendrocytes in mouse cortex stained for CNPase followed by 0.5 µm slices. Tracing the fine processes through each slice enables assessment of the myelin sheaths formed by individual oligodendrocytes.
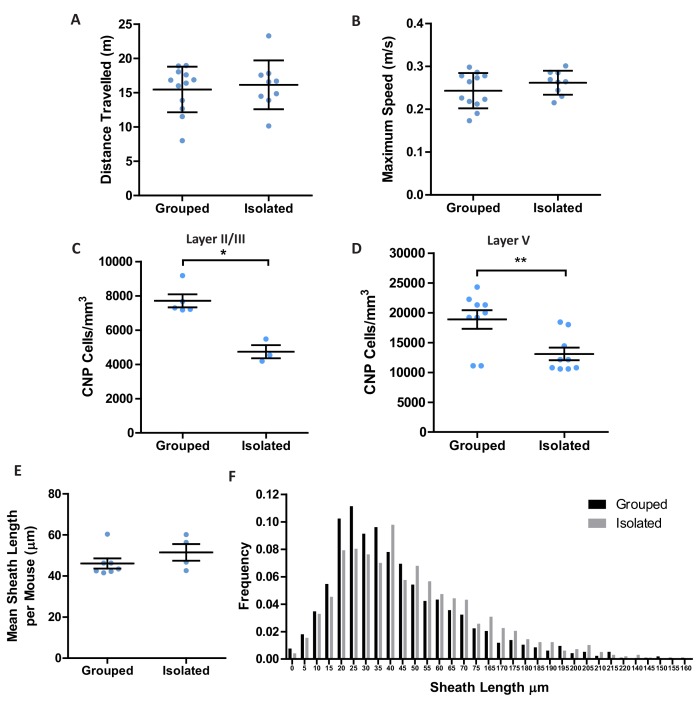
Figure 1—figure supplement 2. Social isolation reduces oligodendrocyte generation in the mPFC.

Figure 1—figure supplement 2.

(A) Distance travelled by mice during 5 min of exploration of the social interaction assay. Grouped 15.48 meters ± 3.326 n = 12 mice, Isolated 16.15 meters ± 3.57 n = 9 mice (mean ± standard deviation). (B) Maximum speed travelled by mice during 5 min of exploration of the social interaction assay. Grouped 0.2433 ± 0.04117 n = 12 mice, Isolated 0.2619 meters ± 0.02792 n = 9 mice (mean ± standard deviation). (C) Quantification of CNP positive cells in medial prefrontal cortex layers II/III: Grouped 7709 ± 378.7 n = 5 mice, Isolated 4738 ± 385.7 n = 4 mice (mean ± standard error). (D) Quantification of CNP positive cells in medial prefrontal cortex layer V: Grouped 18879 ± 1559 n = 9 mice, Isolated 13099 ± 1052 n = 9 mice (mean ± standard error). (E) Mean myelin sheath length formed by oligodendrocytes per mouse. Grouped 46.10 µm ± 2.485 n=seven mice, Isolated 51.48 µm ± 4.08 n=four mice (mean ± standard error). (F) Frequency distribution of myelin sheath lengths.
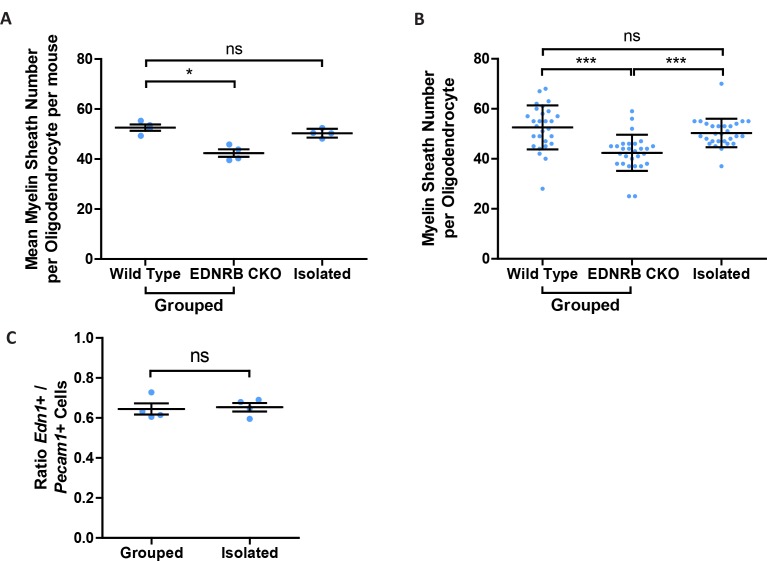
Figure 1—figure supplement 3. Loss of oligodendroglial EDNRB reduces myelin sheath number in the visual cortex where social isolation does not affect myelination or Edn1 expression.

Figure 1—figure supplement 3.

(A) Mean number of myelin sheath formed by oligodendrocytes per mouse. Wild type 52.57 ± 1.270 n = 4 mice, EDNRB CKO 42.39 ± 1.487 n = 4 mice, Isolated 50.32 ± 0.8755 n = 4 mice (mean ± standard error). Mann-Whitney test, p=0.0106. Kruskal-Wallis test, with Dunns post hoc. (B) Pooled data for number of myelin sheaths formed by layer II/III visual cortex oligodendrocytes. Grouped 52.57 ± 8.779 n = 28 cells from four mice, EDNRB CKO 42.39 ± 7.213 n = 28 cells from four mice, Isolated 50.32 ± 5.716 n = 28 cells from four mice (mean ± standard deviation). Kruskal-Wallis test, with Dunns post hoc. (C) Quantification of the number of Edn1 expressing Pecam1 positive cells. Grouped 0.6449 ± 0.02814 n = 4 mice, Isolated 0.63535 ± 0.02120 n = 4 mice (mean ± standard error). Mann-Whitney test.