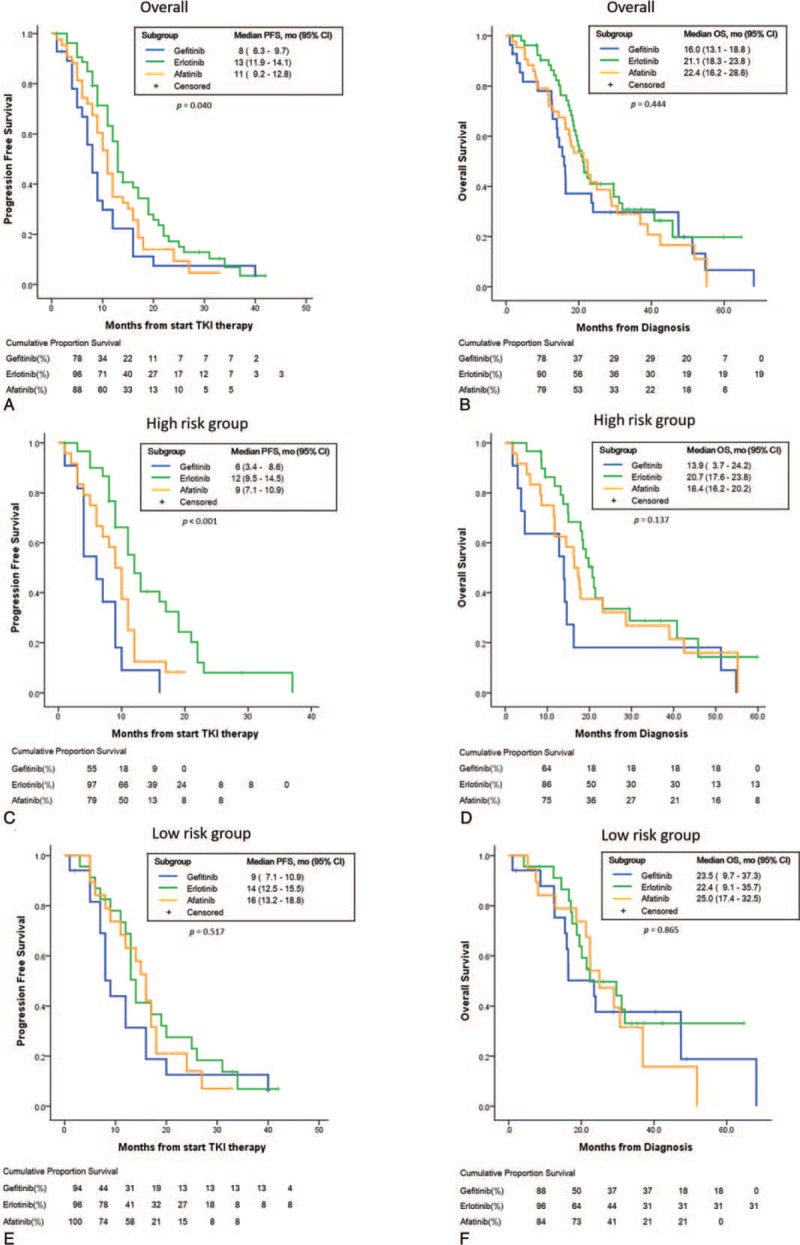
Figure 3.

Kaplan–Meier survival curves verified by log-rank test. (A, B) Comparable PFS and OS in patients treated with gefitinib, erlotinib or afatinib. (C, D) In high risk cohorts, erlotinib showed better PFS but comparable OS to gefitinib or afatinib. (E, F) In low risk cohorts, erlotinib showed comparable PFS and OS to gefitinib or afatinib.
