
Figure 1.
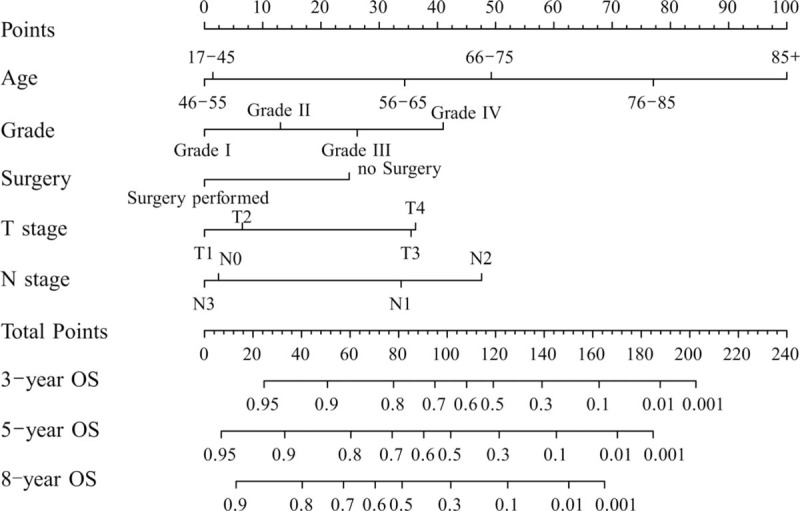
Nomogram used to predict the overall survival (OS) rate. Grades I, II, III, IV represents well-differentiated, moderately differentiated, poorly differentiated, and undifferentiated, respectively.
Official websites use .gov
A
.gov website belongs to an official
government organization in the United States.
Secure .gov websites use HTTPS
A lock (
) or https:// means you've safely
connected to the .gov website. Share sensitive
information only on official, secure websites.
Nomogram used to predict the overall survival (OS) rate. Grades I, II, III, IV represents well-differentiated, moderately differentiated, poorly differentiated, and undifferentiated, respectively.