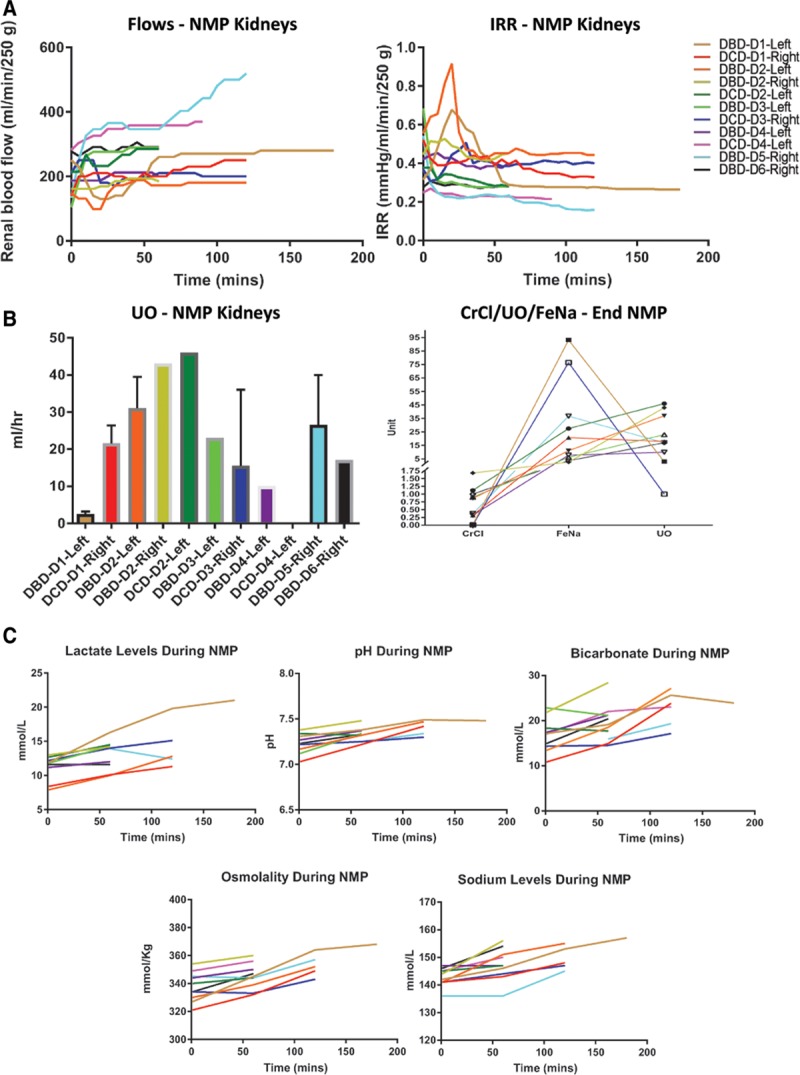
FIGURE 2.

Perfusion, functional, and biochemical changes during normothermic machine perfusion (NMP). A, Renal blood flow and intra-renal resistance (IRR) during NMP, with a mean arterial pressure maintained between 75–85 mm Hg. B, Left panel—Urine output (UO) per h of NMP for each donor kidney. Right panel—Relationship between UO, creatinine clearance (CrCl), and fractional excretion of sodium (FeNa) in each donor kidney. C, Perfusate acid-base balance (pH, lactate, and bicarbonate) and electrolyte (sodium and osmolality) concentrations over the course of NMP, plotted for each individual kidney. DBD, donation after brain death; DCD, donation after circulatory death.
