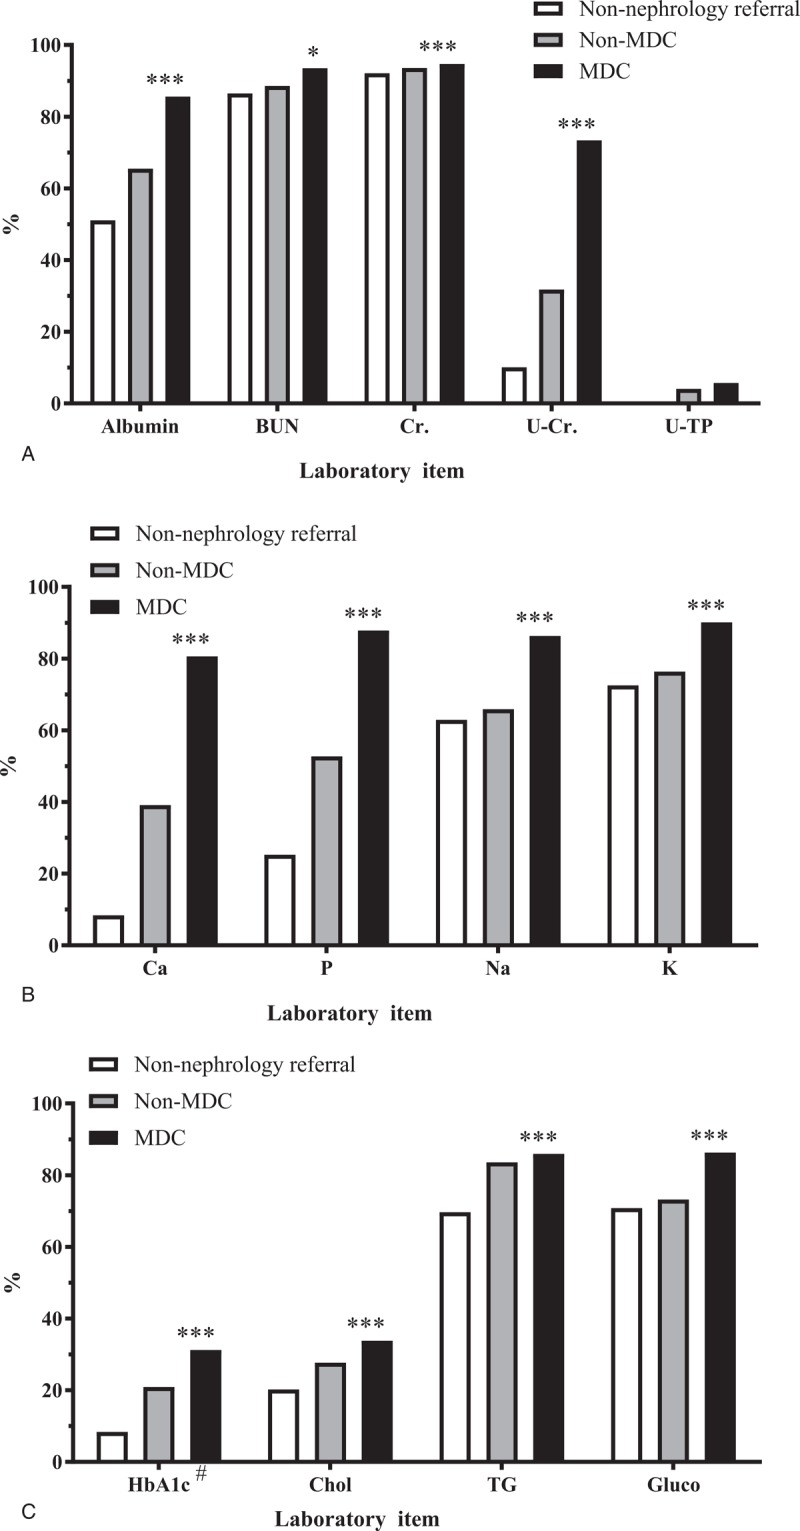
Figure 1.

Proportion of laboratory monitoring in patients with an estimated glomerular filtration rate of ≤45 mL/min/1.73 m2. (A) Laboratory data for chronic kidney disease control; (B) laboratory data for electrolyte control; and (C) laboratory data for metabolic disease control. BUN = blood urea nitrogen, Ca = calcium, Chol = total cholesterol, Cr = creatinine, Gluco = fasting blood glucose, HbA1c = hemoglobin A1c, K = potassium, Na = sodium, P = phosphate, TG = triglyceride, U-Cr = urine creatinine, U-TP = urine total protein. #, Only the data of patients with diabetes were included in the denominator.
