
Figure 3.
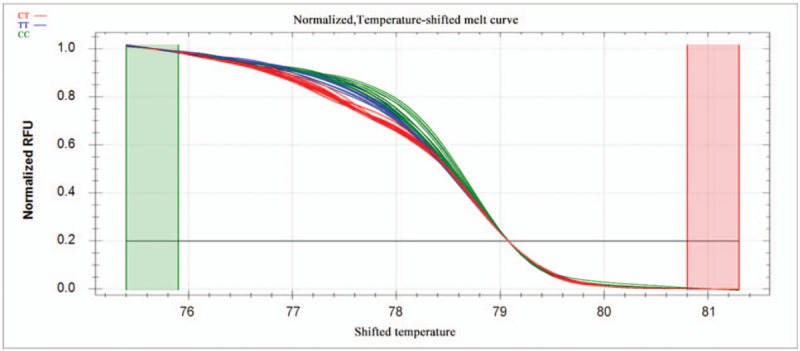
Normalized melting curves for the SNP rs11977660 after temperature shifting. The different colors correspond to the different genotypes as shown at the upper left of the plot. SNP = single-nucleotide polymorphism.
Official websites use .gov
A
.gov website belongs to an official
government organization in the United States.
Secure .gov websites use HTTPS
A lock (
) or https:// means you've safely
connected to the .gov website. Share sensitive
information only on official, secure websites.
Normalized melting curves for the SNP rs11977660 after temperature shifting. The different colors correspond to the different genotypes as shown at the upper left of the plot. SNP = single-nucleotide polymorphism.