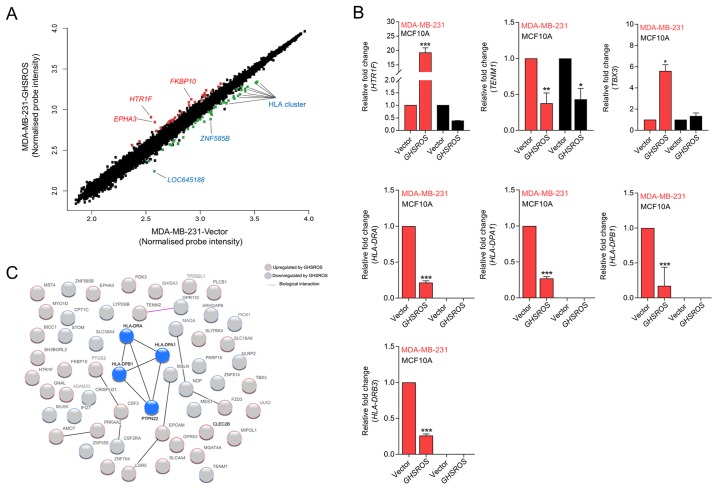
Figure 3.
GHSROS significantly differentially regulates 76 genes in the MDA-MB-231 breast cancer cell line. (A) Scatter plot visualization of induced (red) or repressed (green) genes identified by microarray. The threshold was set at as log2 1.5 fold-change and Q≤0.05 (Benjamini Hochberg-adjusted P-value). EPHA3, HTR1F, FKBP10, LOC645188, ZNF585B and HLA genes were affected by GHSROS. (B) Expression levels of TBX3, HTR1F, TENM1, HLA-DRA, HLA-DRB3, HLA-DPA1 and HLA-DPB1 were measured in cultured MDA-MB-231-GHSROS, MDA-MB-231-Vector, MCF10A-Vector and MCF10A-GHSROS cells by reverse transcription-quantitative polymerase chain reaction. Expression was normalised to the housekeeping gene β-actin. Results are relative to the respective vector control. Data are presented as the mean ± standard error of the mean (n=2); ***P≤0.001 vs. vector control, two-way ANOVA with Bonferroni's post hoc analysis. (C) STRING network consisting of 56 proteins encoded by genes differentially expressed in MDA-MB-231-GHSROS cells. Nodes represent differentially expressed genes. Genes induced (red border) or repressed (blue border) by GHSROS are indicated. Lines between protein nodes indicate biological associations inferred or experimentally demonstrated. Differentially expressed HLA genes are represented by blue nodes in the centre of the cluster. EPHA3, EPH receptor A3; FKBP10, FK506 binding protein 10; GHSROS, growth hormone secretagogue receptor opposite strand; HLA-DRA, MHC, class II, DR α; HLA-DRB3, MHC, class II, DR β3; HLA-DPA1, MHC, class II, DP α1; HLA-DPB1, MHC, class II, DP β1; HTR1F, 5-hydroxytryptamine receptor 1F; MHC, major histocompatibility complex; TBX3, T-box 3; TENM1, teneurin transmembrane protein 1; ZNF585B, zinc finger protein 585B.

