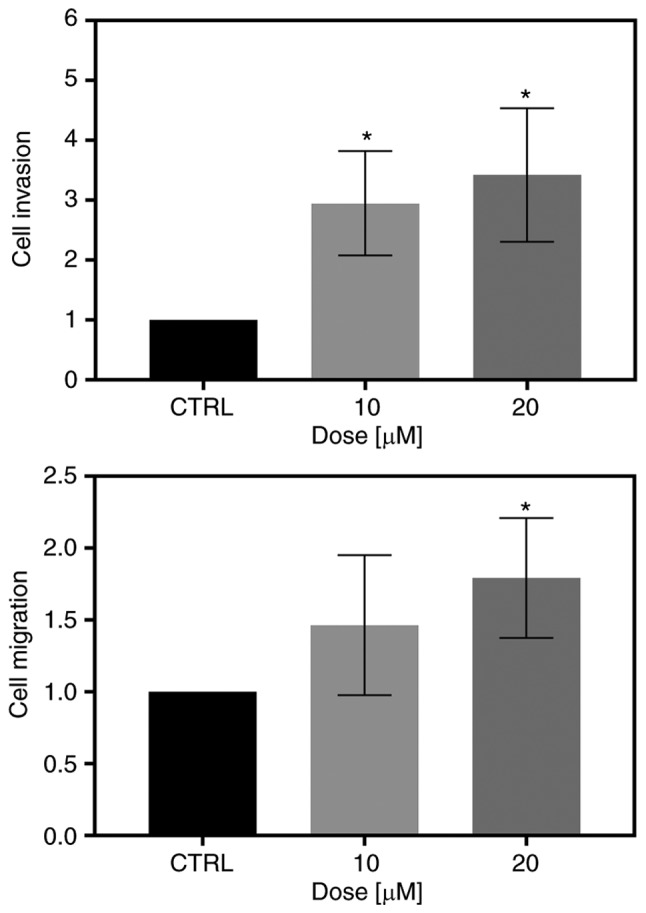
Figure 3.

Evaluation of invasion and migration using a Transwell assay. The K562 cells were treated with 10 or 20 µM fisetin or left untreated (CTRL). The results are expressed relative to control cells (set as 1) and statistical significance between control and treated groups is labeled with an asterisk (*P<0.05; one-way ANOVA with Tukey's post hoc test). Data represent the means ± standard deviation of 2 (migration assay) or 3 (invasion assay) independent experiments, each in duplicate.
