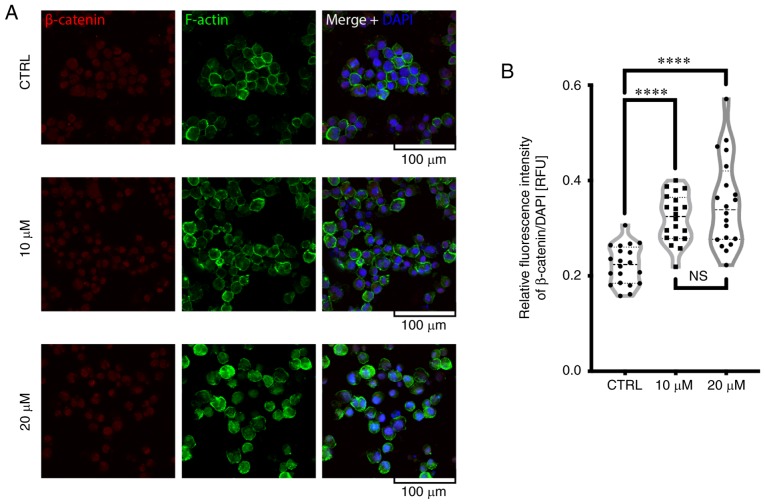
Figure 4.
Assessment of F-actin and β-catenin staining under a confocal microscope. The K562 cells were treated with 10 or 20 µM fisetin for 24 h or left untreated (CTRL). (A) F-actin (green), β-catenin (red) and cell nuclei (DNA, blue) were stained as described in the Materials and methods. (B) The fluorescence intensity of nuclear β-catenin was normalized to the DAPI signal and measured using ImageJ software (****P<0.0001; ns, not significant; Kruskal-Wallis with Dunn's post hoc test). The representative images of 2 independent experiments are shown; scale bar, 100 µm.

