
Figure 2.
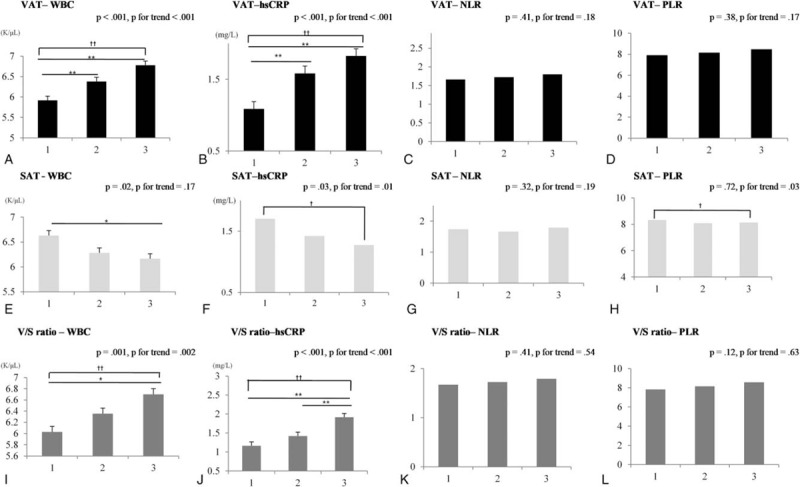
Inflammatory markers according to abdominal fat composition tertiles after adjusting for age, sex, and BMI. Mean (estimated) and standard error (indicated with error bars). ∗P < .05 and ∗∗P < .01 indicate significant differences among tertiles using analysis of covariance. †trend P < .05; ††trend P < .01. T, tertile. A, B, C, D: T1 (24.2–78.4), T2 (79.1–117.2), T3 (117.3–411) cm2; E, F, G, H: T1 (33–196.23), T2 (196.61–287.44), T3 (287.54–1189.11) cm2; I, J, K, L: T1 (0.08–0.3), T2 (0.3–0.48), T3 (0.48–10.82). hsCRP = high-sensitivity C-reactive protein, NLR = neutrophil-lymphocyte ratio, PLR = platelet-lymphocyte ratio, SAT = subcutaneous adipose tissue, VAT = visceral adipose tissue, V/S ratio = VAT/SAT ratio; WBC, white blood cell.