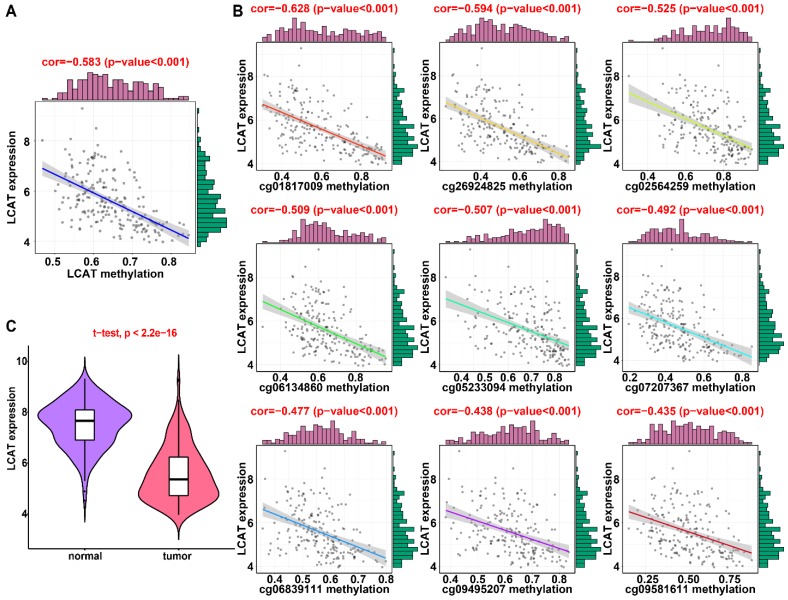
Figure 12.
Regression analysis between gene expression and DNA methylation of LCAT in the GEO training dataset. (A) Regression analysis between gene expression and DNA methylation of LCAT. (B) Regression analysis between gene expression and DNA methylation of CpGs in the LCAT promoter. The vertical axis represents DNA methylation of the DNA methylation-driven gene, and the horizontal axis denotes expression of the DNA methylation-driven gene. The right and upper edges are histograms of DNA methylation and gene expression, respectively. (A) Violin plots of LCAT gene expression.

