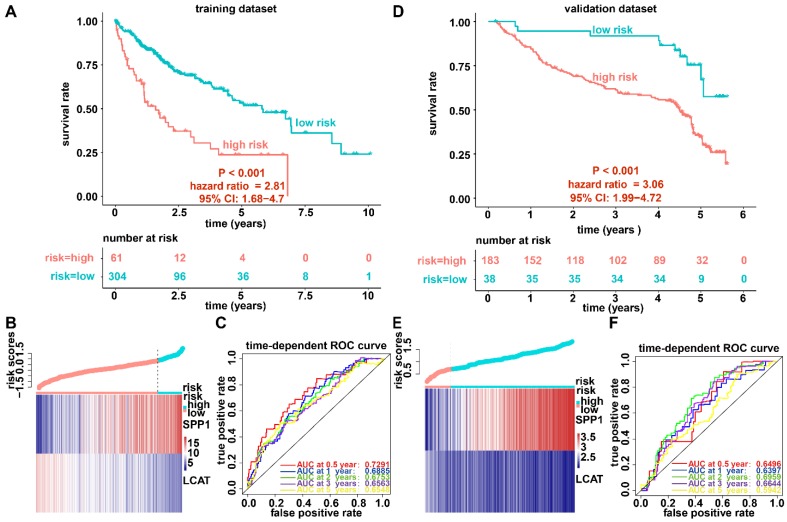
Figure 4.
Survival analysis, risk score distribution, and evaluation of the prognostic model for the training (A-C) and validation (D-F) datasets. (A and D) Kaplan-Meier curve of the prognostic model. (B and E) Distribution of the expression of DNA methylation-driven genes (bottom) and risk score (upper). (C and F) Accuracy of the prognostic model in predicting survival time.

