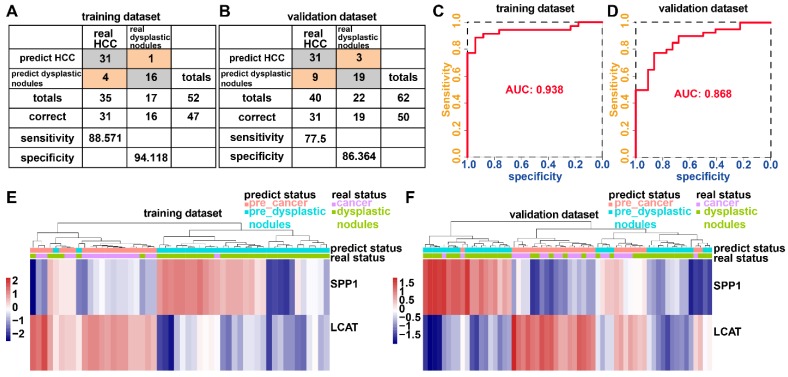
Figure 9.
Two DNA methylation-driven genes for distinguishing HCC from dysplastic nodules. (A and B) Confusion matrices of binary results of the diagnostic prediction model for training (A) and validation (B) datasets. (C and D) ROC curves of the diagnostic prediction models with the two DNA methylation-driven genes for training (C) and validation (D) datasets. (E and F) Unsupervised hierarchical clustering of two DNA methylation-driven genes in the diagnostic prediction model for training (E) and validation (F) datasets.

