Figure 2.
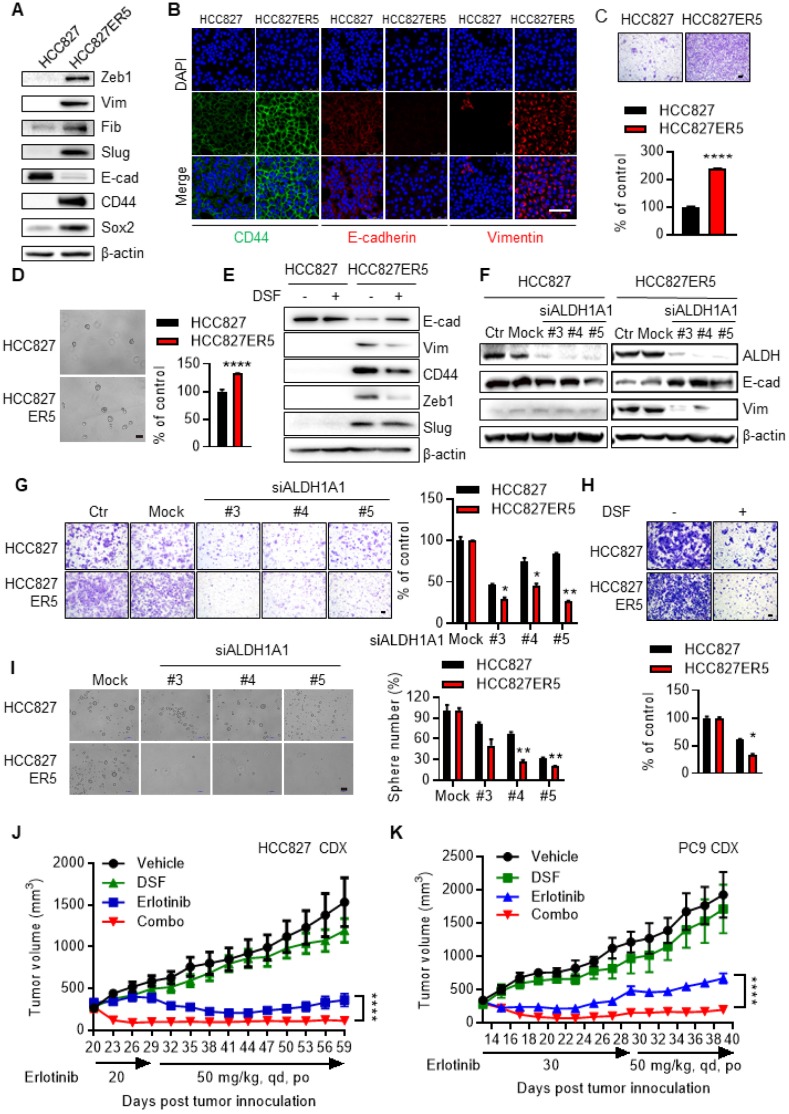
Elevated EMT/CSC properties of the resistant cells depend on ALDH1A1 and targeting ALDH1 overcomes acquired resistance to erlotinib in vivo. (A) Western blot analysis of mesenchymal markers Zeb1, Vim, Fib, and Slug; epithelial marker E-cad; and cancer stemness markers CD44 and Sox2. Vim, vimentin; Fib, fibronectin; E-cad, E-cadherin. (B) Immunofluorescence staining analysis of CSC/EMT markers. DAPI represents the cell nucleus position. Scale bar: 100 µm. (C) Increased migration ability of erlotinib-resistant cells measured by transwell migration assay. Scale bar: 100 µm. Migration ability of HCC827 cells as control. (D) Increased tumorsphere formation ability of the erlotinib-resistant cells. Scale bar: 100 µm. Tumorsphere formation ability of HCC827 cells as control. (E-F) Pharmacological inhibition (E) or genetic knockdown (F) of ALDH1A1 reversed the CSC/EMT properties of erlotinib-resistant cells assayed by western blot analysis of the markers. The cells were exposed to 1 μM DSF for 48 h or 30 nM siRNA for 72 h. (G-H) Genetic knockdown (G) or pharmacological inhibition (H) of ALDH1A1 reversed the increased migration ability of the resistant cells. After the cells were transfected with 30 nM siRNA or treated with 100 μM DSF for 6 h, the transwell migration assays were performed in fresh media without the siRNA or inhibitor. Mock (G) or DSF free (H) data of each corresponding cell line as control. (I) Elevated sphere formation of erlotinib-resistant cells was more sensitive to the knockdown of ALDH1A1. The cells were transfected with 30 nM siRNA for 72 h, and then the sphere formation was performed in the medium without the siRNA. (J and K) Inhibition of ALDH1 overcomes the acquired resistance to erlotinib in HCC827 and PC9 cell-derived xenograft tumors. For the drug treatment group, xenograft harboring mice were treated with the indicated dosage of erlotinib, DSF (60 mg/kg, qd, po), or their combination. The growth of tumors was monitored every 2 d. Tumor (2 per mouse) volume and mouse body weight are presented as mean ± SEM from five mice per group. Details for the xenograft assay are described in Materials and methods.

