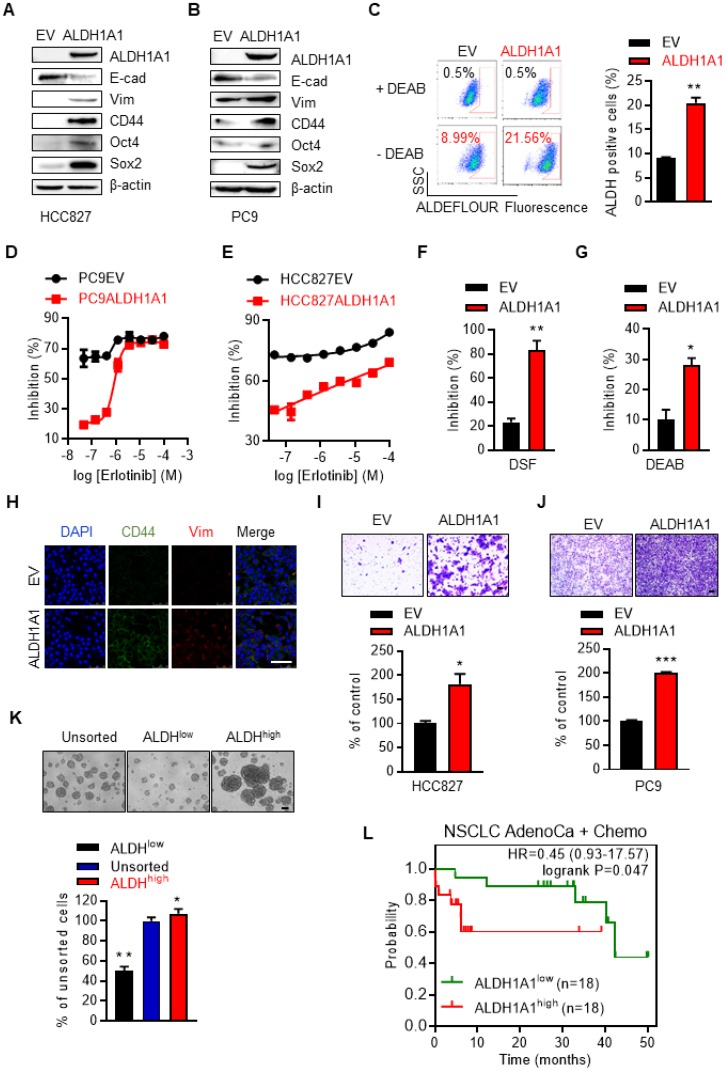
Figure 3.
ALDH1A1 induces resistance to erlotinib in lung adenocarcinomas. (A-B) Western blot analysis of ecto-expression of ALDH1A1 in HCC827 and PC9 cells. The cells were infected with retroviruses expressing ALDH1A1 or empty vectors (EV) as control. (C) Analysis of ALDH1+ cells in HCC827-EV and HCC827-ALDH1A1 cells measured by Aldefluor assay. (D-E) Ecto-expression of ALDH1A1 decreased the inhibitory effect of erlotinib on PC9 (D) and HCC827 (E) cells analyzed by CCK8 cell viability assay. The cells were exposed to erlotinib for 72 h. (F-G) HCC827-ALDH1A1 cells were more sensitive to ALDH1 inhibition by DSF (F) and DEAB (G) compared with the control cells analyzed by CCK8 cell viability assay. The cells were exposed to 10 μM DSF or 100 μM DEAB for 72 h. (H) ALDH1A1 ecto-expression induced CSC/EMT properties assayed by immunofluorescence analysis. Scale bar: 100 µm. (I-J) ALDH1A1 ecto-expressed HCC827 (I) and PC9 (J) cells acquired increased migration ability analyzed by transwell migration assay. Scale bar: 100 µm. (K) Sphere formation assay of FACS-sorted ALDH+ and ALDH- cells. Scale bar: 100 µm. (L) Kaplan-Meier analysis of the association between the probability of overall survival (OS) of lung adenocarcinoma patients who were received chemotherapy (n=36) and their ALDH1A1 gene expression profiles. The analysis was performed by using the online KM-plotter tool (http://kmplot.com/analysis/index.php?p=service&cancer=lung) basing on the Gene Expression Omnibus (GEO) databases GSE29013 and GSE14814. Low or high levels of ALDH1A1 was defined as higher or lower than the median value of 36 patients.

