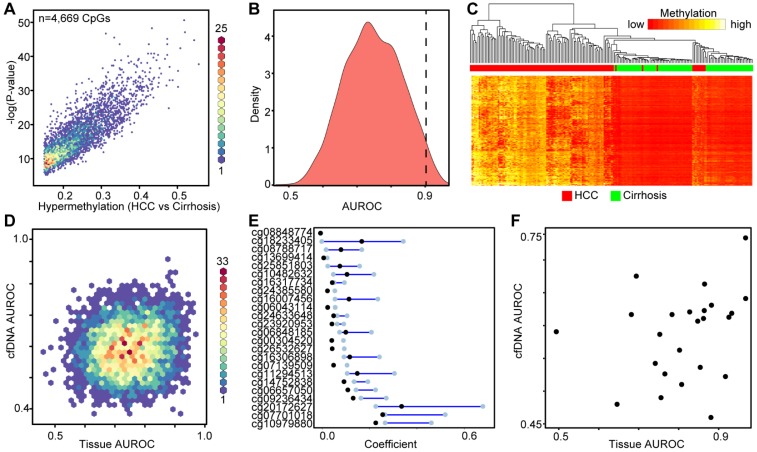
Figure 3.
Discovery of DNA methylation biomarkers in primary liver tissues. A) Binned scatterplot of de novo DNA methylation events that significantly differ between cirrhotic only controls and HCC primary tissues (Δβ > 0.15, P < 0.05). A color bar representing density of CpGs is shown at the right. B) Area under the receiver operating characteristic curves for CpGs identified in (A). C) Heatmap of the 2,000 most differentially methylated CpGs between cirrhosis (green) and HCC (red) tissue. A color bar is shown with low methylation in red and high methylation in yellow. Red/green bar indicates tissue disease state. D) Binned scatterplot of AUROCs for CpGs identified in (A) in primary tissue set 1 analyzed using methylation values at the same CpG sites measured in cfDNA. E) Lasso regression analysis of CpGs identified in (A) presented as a dumbbell chart demarcated by the lower and upper 95% confidence interval of the coefficient (blue bar), with the original coefficient value shown as a black dot for 24 CpGs that reached the coefficient threshold of lower 95% CI > 0. F) A scatterplot of AUROCs from the 24 CpGs selected in (E) in cfDNA and primary tissue. The y-axis is the AUROC in cfDNA, the x-axis is the AUROC in primary tissue set 1.

