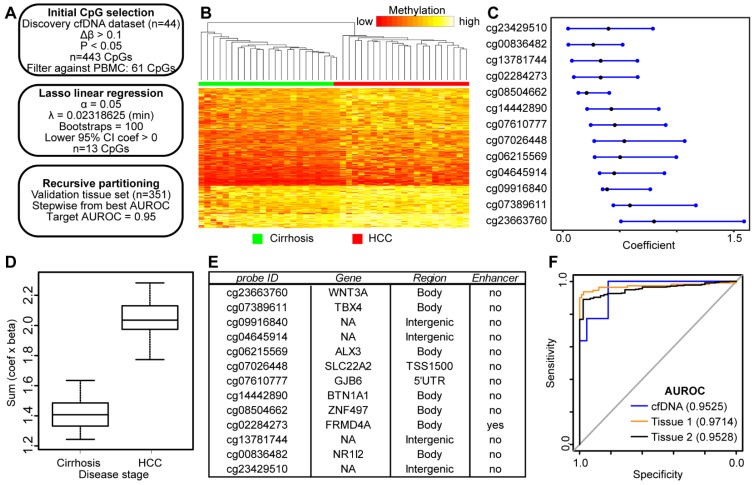
Figure 4.
Discovery and validation of DNA methylation biomarkers derived from cfDNA. A) Schematic representation of the analytic process used to identify biomarkers directly from genome-wide cfDNA methylation data. B) Heatmap of 443 CpGs showing differential methylation between cirrhotic only control and HCC patient-derived cfDNA (Δβ > 0.1, P < 0.05). A color bar is shown to indicate 5mC level. C) Resultant 95% confidence intervals for positively-weighted coefficients identified by Lasso regression of CpGs from part (B). D) Boxplot of the additive sum of coefficients multiplied by β values for the 13 CpGs identified in (C) in cirrhotic- and HCC-derived cfDNA samples. E) List of the high performing CpGs identified from cfDNA along with their associated gene(s), genic features, and link to liver-specific enhancers. F) Receiver operating characteristic curves for a 5 CpG panel in cfDNA (blue), and in two independent primary tissue sets (orange, set 1; black, set 2). CpGs used: cg04645914, cg06215569, cg23663760, cg13781744, and cg07610777.

