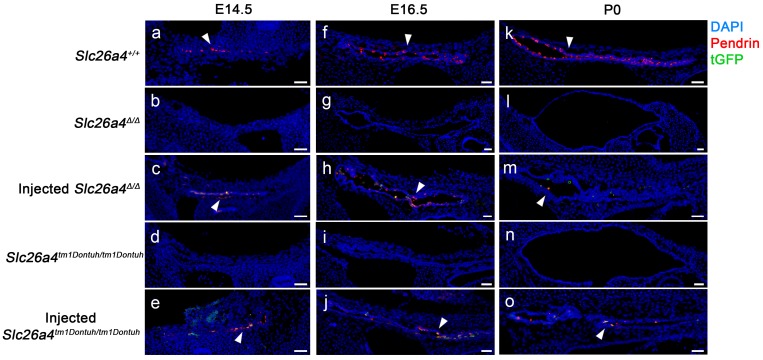
Figure 2.
Pendrin and tGFP protein expression in the endolymphatic sac. Pendrin immunoreactivity (red) and direct fluorescence of tGFP (green) were evaluated in endolymphatic sacs of Slc26a4+/+, Slc26a4Δ/Δ, injected Slc26a4Δ/Δ, Slc26a4tm1Dontuh/tm1Dontuh, and injected Slc26a4tm1Dontuh/tm1Dontuh mice at E14.5 (a-e), E16.5 (f-j) and P0 (k-o). Endogenous pendrin expression was observed in mitochondria-rich cells Slc26a4+/+ mice (a, f, k). A similar pattern of rAAV2/1-Slc26a4-tGFP vector-induced pendrin and tGFP expression was observed in injected Slc26a4∆/∆ mice (c, h, m) and injected Slc26a4tm1Dontuh/tm1Dontuh mice (e, j, o). Nuclei were stained with DAPI (blue). White arrowheads point to representative pendrin-expressing cells. Representative images of 3 replicates each. Scale bars: 20 µm.

