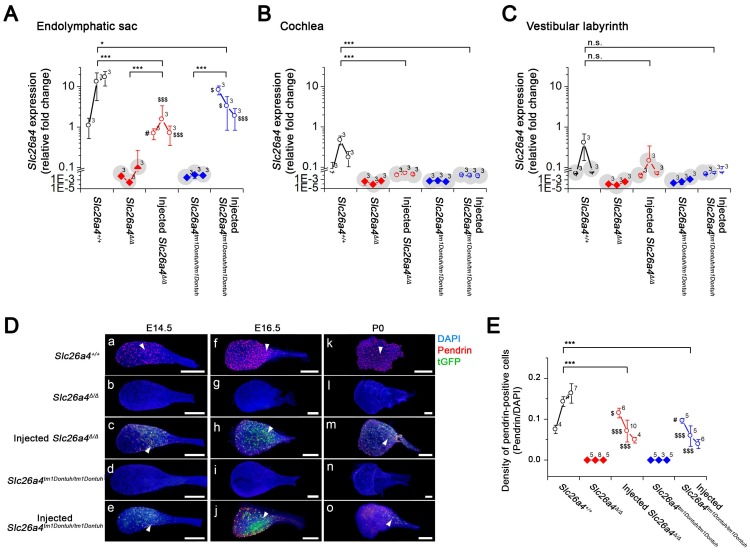
Figure 6.
Expression of the Slc26a4 mRNA, Pendrin and tGFP protein in the developing inner ear. (A-C) Relative Slc26a4+ expression in the endolymphatic sac, cochlea and vestibular labyrinth (mean ± SD). Numbers next to symbols represent the number of biological replicates. Transcripts of endogenous or vector-induced Slc26a4+ mRNA were quantified by qPCR. Reactions were performed on total RNA isolated from endolymphatic sacs (A), cochleae (B) and vestibular labyrinths (C) obtained from Slc26a4+/+, Slc26a4Δ/Δ, rAAV2/1-Slc26a4-tGFP injected Slc26a4Δ/Δ, Slc26a4tm1Dontuh/tm1Dontuh, and rAAV2/1-Slc26a4-tGFP injected Slc26a4tm1Dontuh/tm1Dontuh mice at ages E14.5, E16.5 and P0. Relative fold changes (2-(∆∆Ct)) were obtained from relative Slc26a4+ mRNA expression levels (∆∆Ct) that were calculated by normalizing the level of Slc26a4+ transcripts to the level of Gapdh transcripts in every sample and then normalizing Slc26a4+ transcript levels to the average level in E14.5 endolymphatic sacs of Slc26a4+/+ mice. Slc26a4 expression levels based on Ct values >30 were considered undetected and marked (grey shadow). Significance was evaluated by two-way ANOVA with Bonferroni t-test (A) and by one-way ANOVA on ranks with Tukey pairwise comparison (B-C). Brackets mark comparisons among types of mice: n.s., no significant difference, * p<0.05, ** p<0.01, *** p<0.001. Expression levels in the endolymphatic sac of rAAV2/1-Slc26a4-tGFP injected Slc26a4Δ/Δ and rAAV2/1-Slc26a4-tGFP injected Slc26a4tm1Dontuh/tm1Dontuh mice were compared to Slc26a4+/+ mice: #, no significant difference, $ p<0.05, $$$ p<0.001. Prior to statistical analysis, the data set shown in A was transformed to achieve normality. The data set is available in Supplemental Excel File. (D) Pendrin immunoreactivity (red) and direct fluorescence of tGFP (green) were evaluated in endolymphatic sacs of Slc26a4+/+, Slc26a4Δ/Δ, injected Slc26a4Δ/Δ, Slc26a4tm1Dontuh/tm1Dontuh, and injected Slc26a4tm1Dontuh/tm1Dontuh mice at E14.5 (Da-e), E16.5 (Df-j) and P0 (Dk-o). Endogenous pendrin expression was observed in mitochondria-rich cells Slc26a4+/+ mice (Da,f,k). A similar pattern of rAAV2/1-Slc26a4-tGFP vector-induced pendrin and tGFP expression was observed in injected Slc26a4∆/∆ mice (Dc,h,m) and injected Slc26a4tm1Dontuh/tm1Dontuh mice (De,j,o). The ears of pendrin-deficient mice shown in this figure were the contralateral ears of injected pendrin-deficient mice. Nuclei were stained with DAPI (blue). White arrowheads point to representative pendrin-expressing cells. Scale bars: 200 µm. (E) The density of pendrin-expressing cells, obtained as ratio of pendrin-immunoreactive and DAPI-stained epithelial cells, in endolymphatic sacs obtained from Slc26a4+/+, Slc26a4Δ/Δ, rAAV2/1-Slc26a4-tGFP injected Slc26a4Δ/Δ, Slc26a4tm1Dontuh/tm1Dontuh, and rAAV2/1-Slc26a4-tGFP injected Slc26a4tm1Dontuh/tm1Dontuh mice at ages E14.5, E16.5 and P0. Significance was evaluated by two-way ANOVA with Bonferroni t-test. Brackets mark comparisons among types of mice: *** p<0.001. Expression levels in the endolymphatic sac of rAAV2/1-Slc26a4-tGFP injected Slc26a4Δ/Δ and rAAV2/1-Slc26a4-tGFP injected Slc26a4tm1Dontuh/tm1Dontuh mice were compared to Slc26a4+/+ mice: #, no significant difference, $ p<0.05, $$$ p<0.001. The data set is available in Supplemental Excel File.

