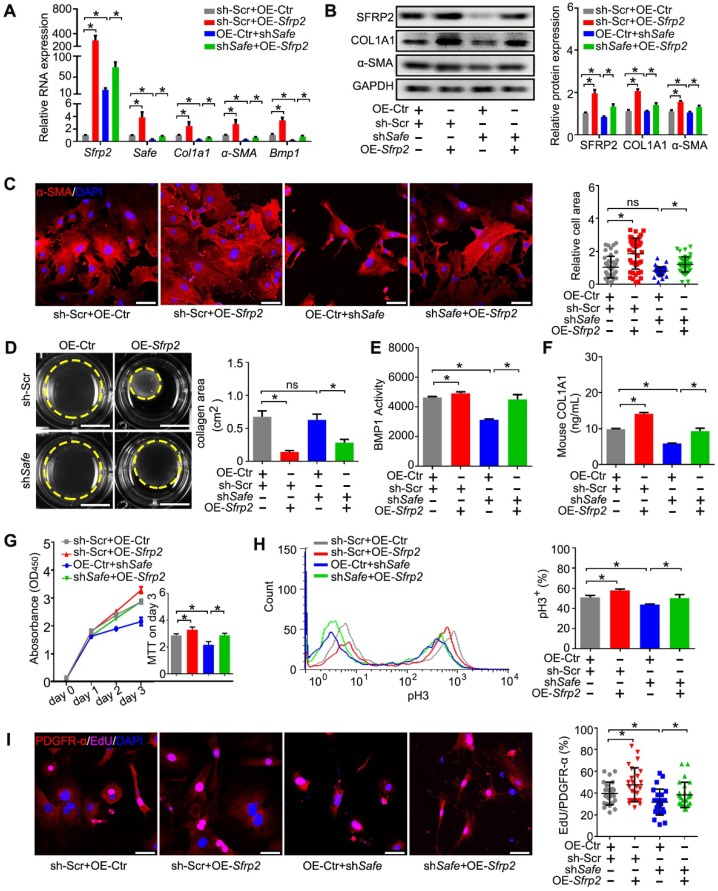
Figure 5.
Sfrp2 overexpression disturbed the regulatory effects of shSafe in cardiac fibroblasts. (A) qRT-PCR analysis showing mRNA expression of Safe, Sfrp2, Col1a1, α-SMA and Bmp1 by Sfrp2 overexpression in Safe-silenced cardiac fibroblasts (n=3). (B) Representative western blot analysis and relative densitometric quantification showing up-regulated expression of SFRP2, COL1A1, and α-SMA proteins by Sfrp2 overexpression in Safe-silenced cardiac fibroblasts (n=3). (C) Representative images of immunofluorescence staining for α-SMA (red, n=5) and quantification of the relative cell area of cardiac fibroblasts after treatments as indicated (n=40). Scale bar indicates 50 μm. (D) Representative images of collagen gel contraction for 24 hours and quantification of collagen area inside the dashed circles (n=3). Scale bar indicates 0.5 cm. (E) BMP1 protein enzyme activity in the supernatant of cultured fibroblasts after indicated treatments (n=3). The excitation wavelength is 320 nm, and the emission wavelength is 405 nm. (F) ELISA assay of COL1A1 protein in the supernatant of cultured fibroblasts after indicated treatments (n=3). (G) CCK-8 assay of cardiac fibroblasts showing restored cell proliferation by Sfrp2 overexpression in Safe-deficient cardiac fibroblasts (n=3). (H) Flow cytometry analysis of pH3 incorporation in Sfrp2 overexpressed-stimulated fibroblasts with indicated treatments. (I) Representative images of immunofluorescence staining for EdU (magenta), PDGFR-α (red) and DAPI (blue). Scale bar indicates 50 μm. Right panel: Percent of EdU+ cells in PDGFR-α+ cells (n=25). All data are presented as mean ± SEM; Student's t-test or one-way ANOVA; *p < 0.05.

