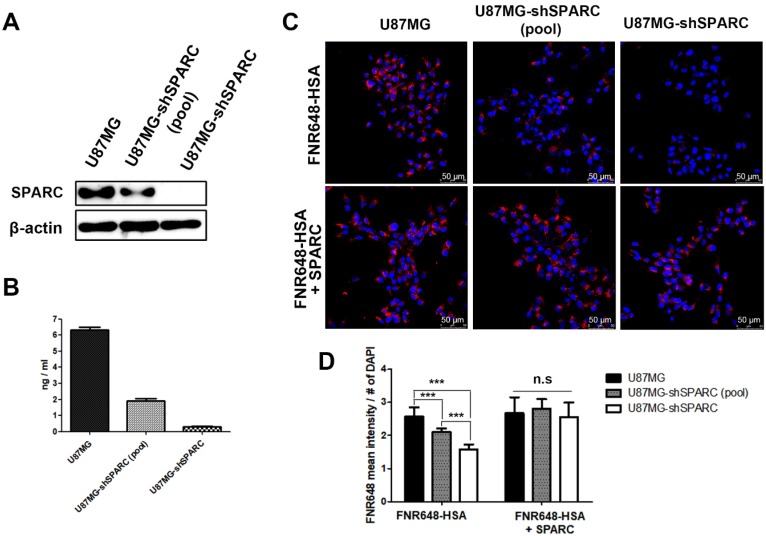
Figure 1.
SPARC protein expression and FNR648-HSA uptake in U87MG cells expressing different levels of SPARC. SPARC expression in (A) Cell lysates and (B) conditioned serum-free cell media. (C) Representative cell images after FNR648-HSA treatment. To demonstrate the effect of SPARC on intracellular uptake of HSA, SPARC was treated with FNR648-HSA. Scale bar, 50 μm. (D) Quantification of FNR648-HSA uptake in each cell type from confocal images. ***: P < 0.001.

