Figure 2.
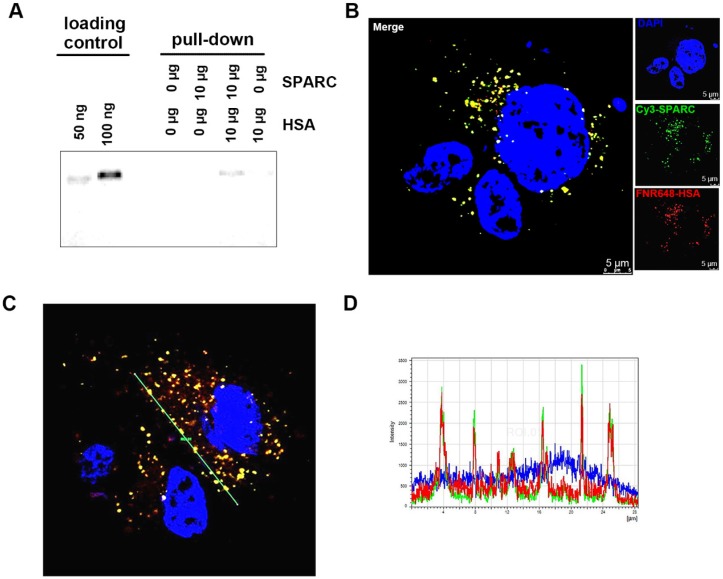
Confirmation of binding of HSA and SPARC at the protein and cellular levels. (A) Fluorescence image of immunoprecipitated samples. SPARC antibody was used and SPARC-bound albumin was detected by FNR648. (B-C) Fluorescence imaging of Cy3-SPARC- and FNR648-HSA-treated cells. To visualize the co-localization of SPARC and HSA in cells, FRET methodology was used in U87MG cells (B-C); Cy3-SPARC (λ excitation: 514 nm; λ emission: 540-600 nm) and FNR648-HSA (λ emission: 640-750 nm). (B) Representative FRET images. (C) Representative line ROI analysis of the signal. The green line represents the line ROI in the confocal images. (D) Signal intensity vs. location graph from (C). Line ROI signal graph shows co-localization of Cy3-SPARC and FNR648-HSA in cells. Scale bar, in (B) 5 μm.

