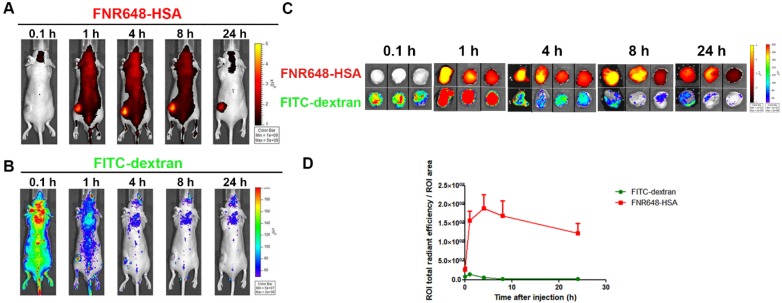
Figure 4.
Distribution of FNR648-HSA and FITC-dextran in U87MG tumor-bearing mice. Time-course images of mice after intravenous injection of FNR648-HSA and FITC-dextran. (A) FNR648-HSA images and (B) FITC-dextran images. (C) Ex vivo images of tumors acquired at indicated time-points after FNR648-HSA and FITC-dextran injections. Tumor images were acquired at each time-point after sacrificing the mice (n = 3 for 0.1, 1, 8, 24 h after injection and n = 4 for 4 h). (D) Fluorescence signal analysis using ex vivo tumors. Mice whole body images for tumor ex-vivo signal analysis are shown in Figure S6.

