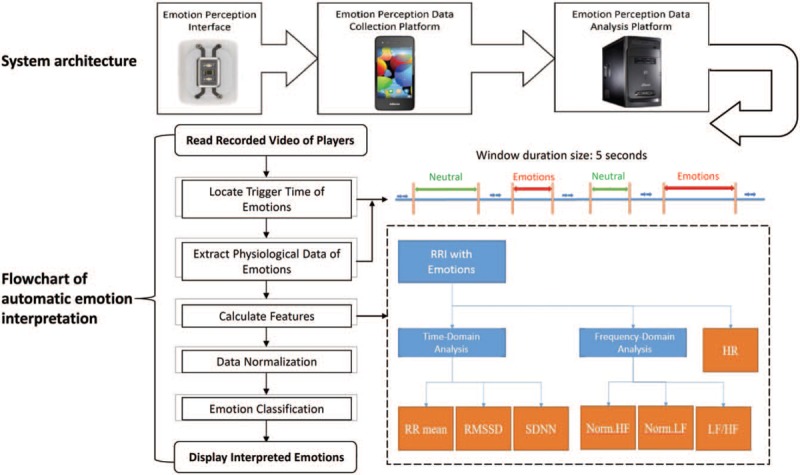
Figure 1.

System architecture and flowchart of automatic emotion interpretation. The system architecture consists of three components. Heart rate (HR) data and R-R interval (RRI) during neutral and triggered-emotion statuses were extracted for signal analysis. The total extraction time was up to 30 minutes for each of the neutral and triggered-emotion statuses. Window duration time was set as 5 seconds and resampled to 4 Hz for the Fast Fourier Transform (FFT). Time-domain features, frequency-domain features, and HR were used for ANN-based classification. As per the suggested standards of measurement of HRV, the RR mean, Standard Deviation of Normal to Normal (SDNN), and Root Mean Square of Successive Differences (RMSSD) were used for time domains. With regard to power spectrum density, frequencies between 0.04 Hz and 0.15 Hz were defined as low frequency (LF) and those between 0.15 Hz and 0.4 Hz were defined as high frequency (HF). The features of the data were calculated and normalized for the classification algorithm (Norm.HF = normalized high frequency; Norm.LF = normalized low frequency).
