
Figure 2.
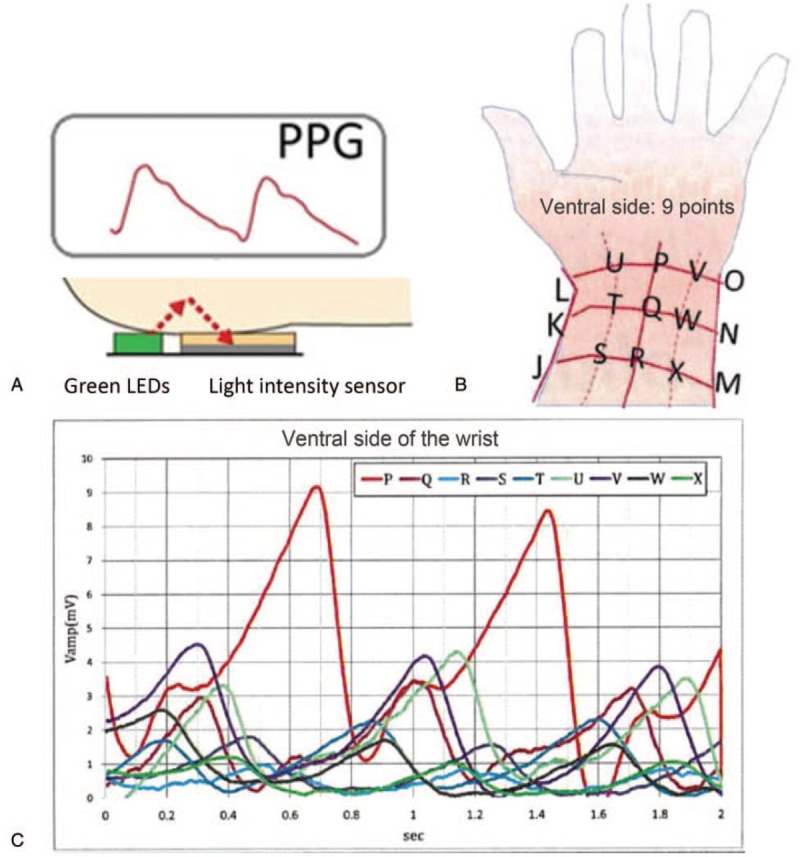
Illustration of the photoplethysmogram (PPG). In the wristband heart rate monitor, there are 2 green light emitting diodes (LEDs) and 1 light-intensity sensor (Panel A). The photodiode sensor detects the reflected green light that is emitted by the LEDs; it penetrates the skin to reach the dermis layer where abundant blood vessels exist. Because hemoglobin in the blood vessels absorbs the light emitted by the green LED, we are able to detect rhythmic changes in the reflected light intensity that is synchronized with the cardiac pumping rate. The changes in the reflected light intensity can be utilized to calculate heart rate and heart rate variability. The detected PPG wave was strongest at the middle line of the ventral wrist, which is denoted as “P” in Panels B and C.