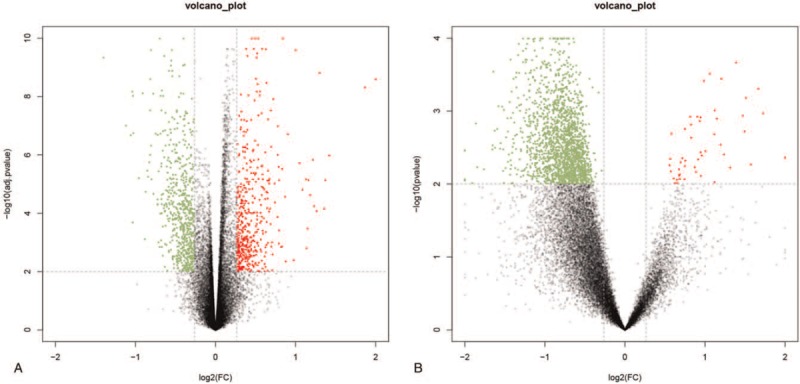
Figure 1.

Volcano map of DEGs in GSE54514 (A) and GSE63042 (B). The abscissa represents the log2 (fold change) value of the gene and the ordinate represents the -log10 (adj. P value). The red dots represent the genes that are up-regulated in the death group, while the green dots represent the genes that are down-regulated in the death group.
