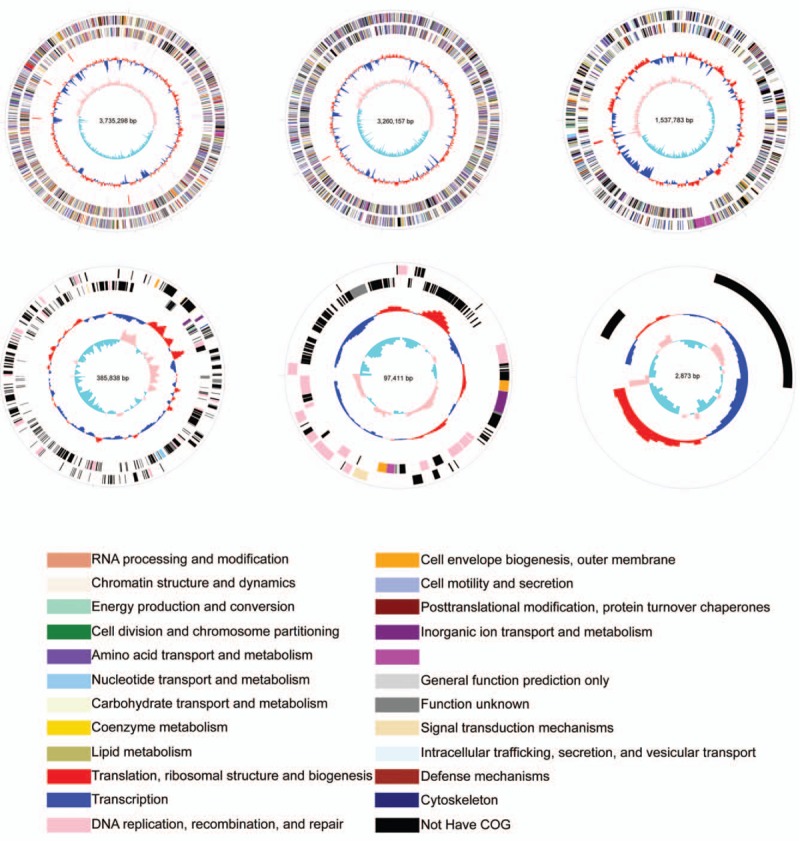
Figure 1.

Genome of Burkholderia sp. CQ001. The genome size, GC content, COG category, homologous genes were analyzed via GenomeViz and Circos softwares. The outermost circle represents CDs on the sense strand. Going inwards, the next circle represents CDs on the antisense strand. Different colors represent different COG categories. The third circle represents rRNA and tRNA. The next circle indicates GC content (below average GC content (blue) and above average GC content (yellow)). The innermost represents GC skew value (G-C/G+C). The value is positive when CDs locate on the positive strand, and negative when CDs locate on the negative strand. COG = Clusters of Orthologous Groups of proteins.
