Figure 1.
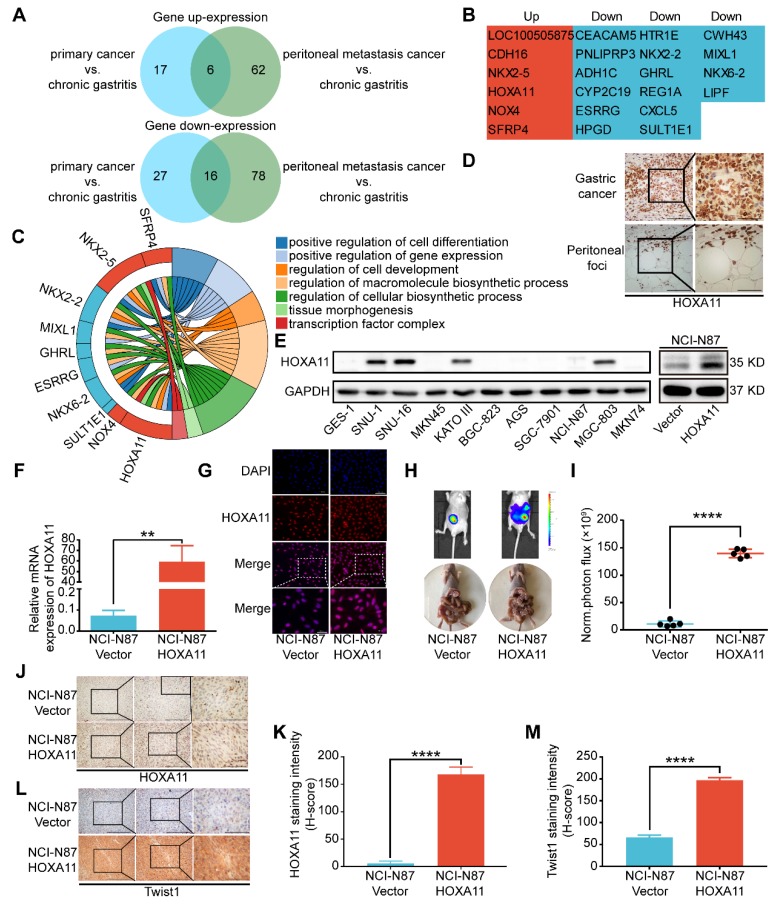
HOXA11 was high expressed in the peritoneal foci of gastric cancer and promoted peritoneal metastasis. (A) A venn diagram summarized the upregulated genes and downregulated genes in both primary gastric cancer and peritoneal foci when compared with the adjacent chronic gastritis tissues. (B) The list shown the genes' name which belong to the category of upregulated and downregulated genes, respectively. (C) Chordal graph shown the pathway analysis of shared upregulated and down-regulated genes in both primary gastric cancer and peritoneal foci by GO enrichment. (D) Immunohistochemistry assay show the expression of HOXA11 in both primary gastric cancer and peritoneal foci, the left scale bar, 200 μm, 200× magnification, the right scale bar, 100 μm, 400× magnification. (E) Left: western blot analysis of HOXA11 protein levels in 10 gastric cancer cells and normal gastric epithelial cell line GES-1, right: expression of HOXA11 of indicated cells were analyzed using western blot, and GAPDH was used as a loading control. Each experiment was performed in triplicate. (F) Expression of HOXA11 of indicated cells were analyzed using qRT-PCR. Results were shown as mean ± SEM of three independent experiments, each experiment was performed in triplicate. **, P<0.01 (Student t test). (G) Immunofluorescence staining for HOXA11 in NCI-N87-Vector and NCI-N87-HOXA11 cells are shown here (HOXA11, red; DAPI, blue). The scale bar, 100 μm, 200× magnification; 50 μm, 400× magnification. Each experiment was performed in triplicate. (H) Overexpression of HOXA11 promoted peritoneal metastasis of gastric cancer cells in BALB/c mice. Tumor in both groups are measured both in situ and after laparotomy. (I) Statistical analysis of the bioluminescence in peritoneal foci of both groups. Results were shown as mean ± SEM, ****, P<0.0001 (Student t test). (J & L) Immunohistochemistry assay shown the expression of HOXA11 and Twist1 in peritoneal foci derived from NCI-N87-Vector and NCI-N87-HOXA11 cell groups, respectively. The scale bar, from left to right, 400 μm, 100× magnification; 200 μm, 200× magnification; 100 μm, 400× magnification. (K & M) Statistical analysis of HOXA11 and Twist1 staining intensity (H-score) in both groups. Results were shown as mean ± SEM of three independent experiments, each experiment was performed in triplicate. ****, P<0.0001 (Student t test).

