Figure 3.
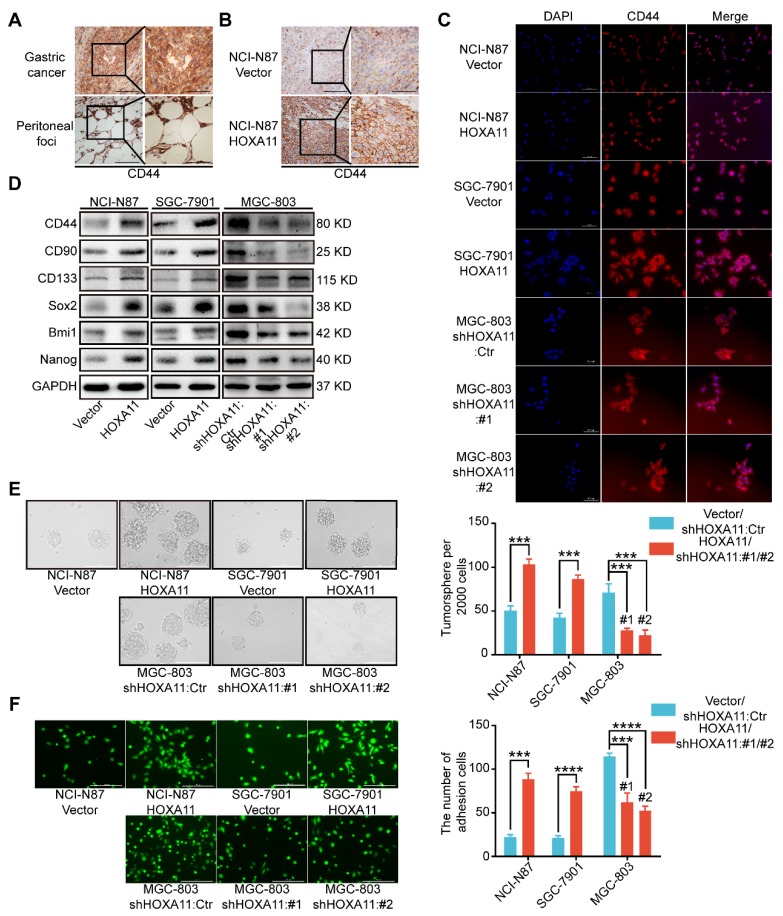
HOXA11 enhanced gastric cancer cell stemness and adhesion. (A) Immunohistochemistry assay shown the expression of CD44 in both primary gastric cancer and peritoneal foci, the left scale bar, 200 μm, 200× magnification; the right scale bar, 100 μm, 400× magnification. (B) Immunohistochemistry assay shown the expression of CD44 in peritoneal foci derived from NCI-N87-Vector and NCI-N87-HOXA11 cell groups, the left scale bar, 200 μm, 200× magnification; the right scale bar, 100 μm, 400× magnification. (C) Immunofluorescence staining for CD44 in NCI-N87-Vector, NCI-N87-HOXA11, SGC-7901-Vector, SGC-7901-HOXA11, MGC-803-Control, MGC-803-shHOXA11 #1 and MGC-803-shHOXA11 #2 cells were shown here (CD44, red; DAPI, blue). The scale bar. 100 μm, 200× magnification; each experiment was performed in triplicate. (D) The protein expression of CD44, CD90, CD133, Sox2, Bmi1 and Nanog in NCI-N87-Vector, NCI-N87-HOXA11, SGC-7901-Vector, SGC-7901-HOXA11, MGC-803-Control, MGC-803-shHOXA11 #1 and MGC-803-shHOXA11 #2 cells were analyzed using western blot with the indicated antibodies. GAPDH was used as the internal protein loading control. Each experiment was performed in triplicate. (E) Representative images of tumorsphere formed by the indicated cells in suspension with cancer stem cell medium. Histograms shown the mean number of tumorsphere. The scale bar, 400 μm, 100× magnification. Results were shown as mean ± SEM of three independent experiments, each experiment was performed in triplicate. ***, P<0.001 (Student t test and the analysis of variance test). (F) Representative images of adhesion assays which gastric cancer cells adhere to the HPMC. Histograms shown the number of adhered gastric cancer cells in each group. The scale bar, 400 μm, 100× magnification. Results were shown as mean ± SEM of three independent experiments, each experiment was performed in triplicate. ***, P<0.001; ****, P<0.0001 (Student t test and the analysis of variance test).

