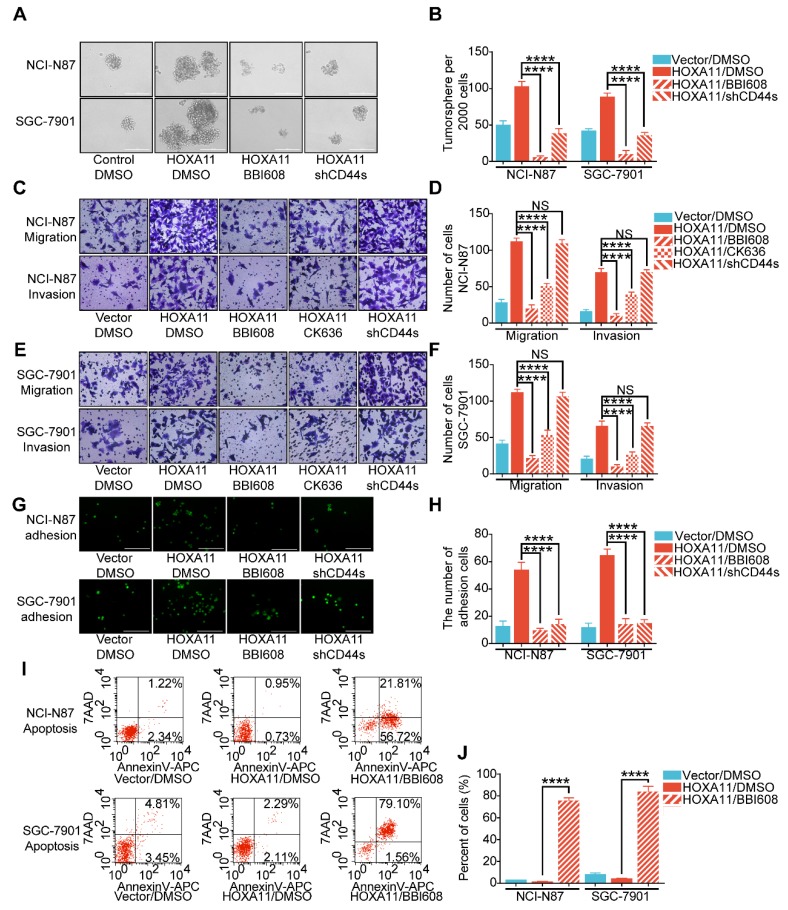
Figure 5.
HOXA11 mediated malignant phenotypes which was required for transcriptional activation of Stat3. (A & B) Representative images of tumorsphere formed by the indicated cells in suspension with cancer stem cell medium and then treated with either DMSO or BBI608 (NCI-N87-HOXA11 cells: 3 μM or SGC-7901-HOXA11 cells: 6.5 μM) for 24 h at 37°C. Histograms shown the mean number of tumorsphere. The scale bar, 400 μm, 100× magnification. Results were shown as mean ± SEM of three independent experiments, each experiment was performed in triplicate. ****, P<0.0001 (the analysis of variance test). (C to F) Representative images of cell migration and invasion assays were performed to investigate the indicated cells treated with knockdown of CD44s, BBI608 (NCI-N87-HOXA11 cells: 3 μM or SGC-7901-HOXA11 cells: 6.5 μM), CK636 (4 μM) or DMSO for 24 h at 37°C. The scale bar, 120 μm, 200× magnification. Histograms shown the number of migratory/invading cells. Results were shown as mean ± SEM of three independent experiments, each experiment was performed in triplicate. NS, no significance; ***, P<0.001; ****, P<0.0001 (the analysis of variance test). (G & H) Representative images of adhesion assays which the indicated cells treated with knockdown of CD44s, BBI608 (NCI-N87-HOXA11 cells: 3 μM or SGC-7901-HOXA11 cells: 6.5 μM) or DMSO for 24 h at 37°C, and then trypsinized into single suspension and adhered to the HPMC for 3 h. Histograms shown the number of adhered gastric cancer cells in each group. The scale bar, 400 μm, 100× magnification. Results were shown as mean ± SEM of three independent experiments, each experiment was performed in triplicate. ****, P<0.0001 (the analysis of variance test). (I & J) The apoptosis of indicated cells treated with BBI608 (NCI-N87-HOXA11 cells: 3 μM or SGC-7901-HOXA11 cells: 6.5 μM) or DMSO for 24 h at 37°C were analyzed by flow cytometry via labeling with APC-Annexin-V and 7-AAD. Representative images were shown. Histograms shown the apoptosis level of each group respectively. Results were shown as mean ± SEM of three independent experiments, each experiment was performed in triplicate. ****, P<0.0001 (the analysis of variance test).

