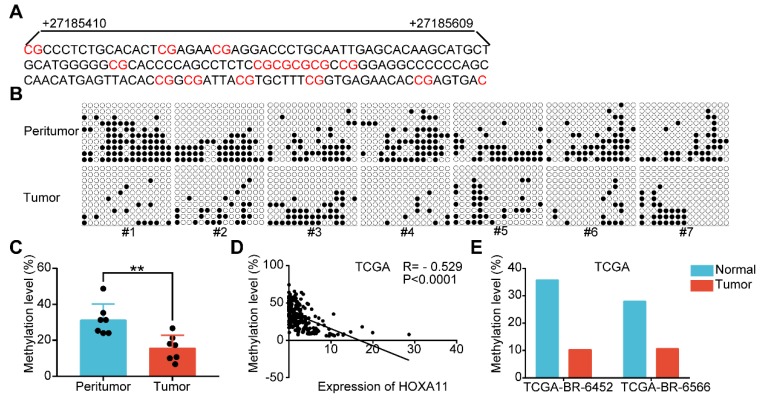
Figure 8.
HOXA11 expression and promoter methylation in primary gastric cancer tissues and peritumor normal tissues. (A) The schematic illustration of 15 CpG sites located between nucleotides +27185410-+27185609 in the HOXA11 promoter for BSP. (B & C) BSP was performed to evaluate HOXA11 CpG island methylation statuses in seven paired gastric cancer tissues and peritumor normal tissues. All images and corresponding statistical plots were presented. Filled circles and open circles represent methylated and unmethylated CpG sites, respectively. (D) The correlation between expression of HOXA11 and methylation level of HOXA11 promoter in TCGA database. (E) The methylation level of HOXA11 promoter in two paired gastric cancer tissues and peritumor normal tissues (TCGA-BR-6452 & TCGA-BR-6566).

