Figure 2.
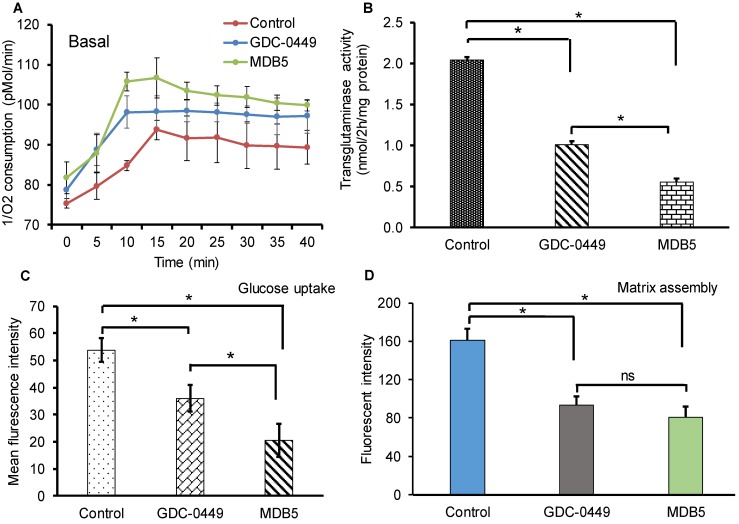
Effect of Hh inhibitors on cellular metabolism, transglutaminase activity, and fibronectin matrix assembly. (A) HSCs were treated with MDB5 and GDC-0449, and basal oxygen consumption rate (OCR) was determined after 24 h. (B) Transglutaminase activity was determined by colorimetric assay after treating cells with GDC-0449 or MDB5 at their IC50. (C) Glucose uptake study was determined using 2-NBDG kit after 24h treatment with GDC-0449 or MDB5. We found a correlation between the amount of transglutaminase activity and the extent of Hh pathway activation. (D) Fibronectin assembly assay of HSC-T6 cells treated with DMSO, GDC-0449 or MDB5 (50 µM) for 24 h. A t-test was used to compare different groups, and p<0.05 was considered statistically significant. *: P<0.05 between the two groups (n=5).

