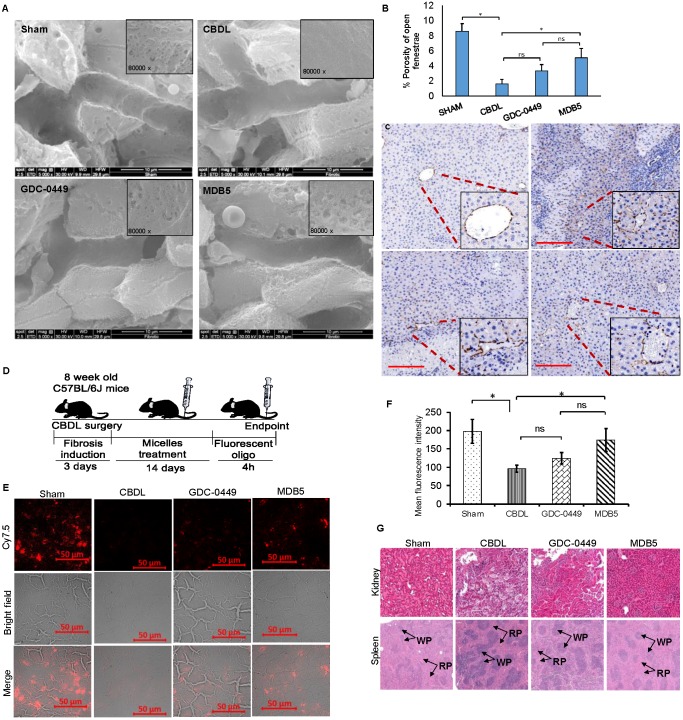
Figure 8.
Effect of Hh pathway inhibition on LSEC capillarization and distribution of fluorescent micelles in the liver. a SEM of liver tissues (scale bar 10 µm, inset magnification= 80000X). b Percentage porosity of open fenestrae in different groups. c IHC staining for CD31 protein; a marker for capillarization (Objective 10X, inset objective 40X, scale bar 200 µM). d Experimental plan for biodistribution study. Micelles loaded with Cy5.5 labelled scrambled oligonucleotide were injected, and the liver tissues were collected 4 h post injection. e Representative image of liver slides showing fluorescent micelles for distribution. f Quantitation of fluorescent signal after extraction of oligonucleotide from different treatment groups. g H & E staining of kidney and spleen after two weeks of treatment with GDC-0449 or MDB5 loaded micelles. A t-test was used to compare different groups, and p<0.05 was considered statistically significant. *: P<0.05 between the two groups (n=5).

