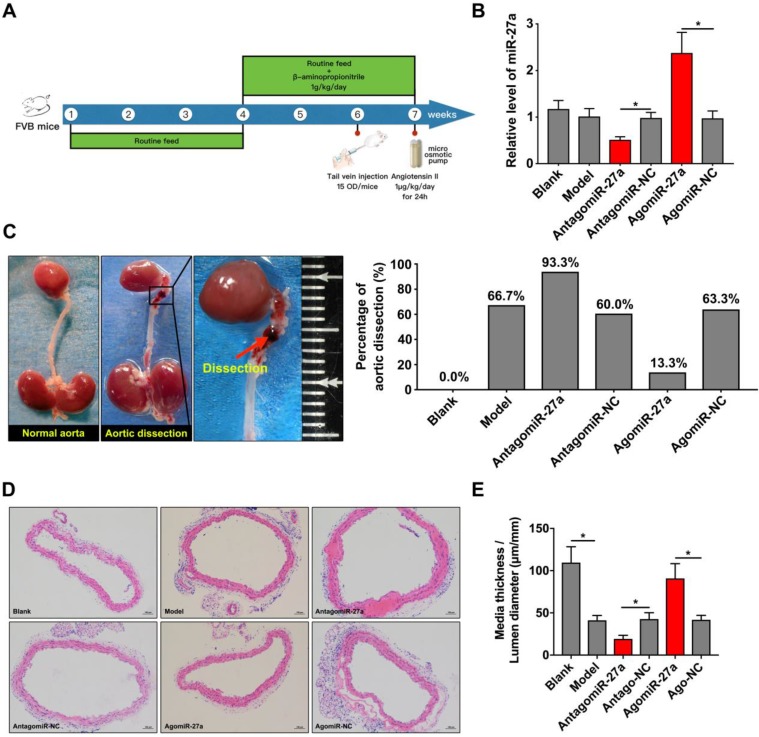
Figure 5.
miR-27a suppression resulted in promotion of AD in vivo . (A) The flow chart of in vivo experiment. (B) qRT-PCR experiment to identify the interfering effect on mice aorta of agomiR-27a and antagomiR-27a (n=15 per group). (C) Typical images showed macroscopic features of isolated mice aorta and the incidence rate of AD after treatment. (D) Representative images of H&E staining. (E) Quantification results of media thickness / lumen diameter. Data are represented as mean ± SD; *P<0.05.

