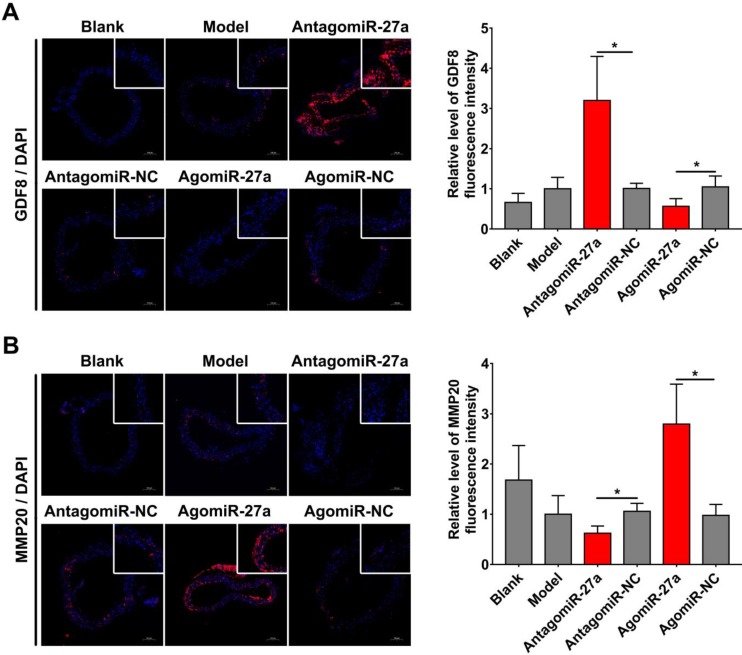
Figure 7.
miR-27a regulated GDF8 and MMP20's expression in murine model for AD. (A) Immunofluorescence staining and relative fluorescence intensity of GDF8 showing the expression pattern in murine model for AD. (B) Immunofluorescence staining and relative fluorescence intensity of MMP20 showing the expression pattern in murine model for AD. The model group was normalized as one. n=15 per group. Scale bars represent 100μm. Data are represented as mean ± SD; *P<0.05.

